Metro Ridership Keeps Growing, with a Million Daily Riders in October
Metro transit ridership keeps on growing. The latest Metro ridership statistics show that October 2024 was the second consecutive month when Metro averaged more than a million daily weekday boardings. With 1,025,262 daily boardings, October saw the agency’s highest pandemic-era ridership, narrowly beating the prior month’s 1,023,399.
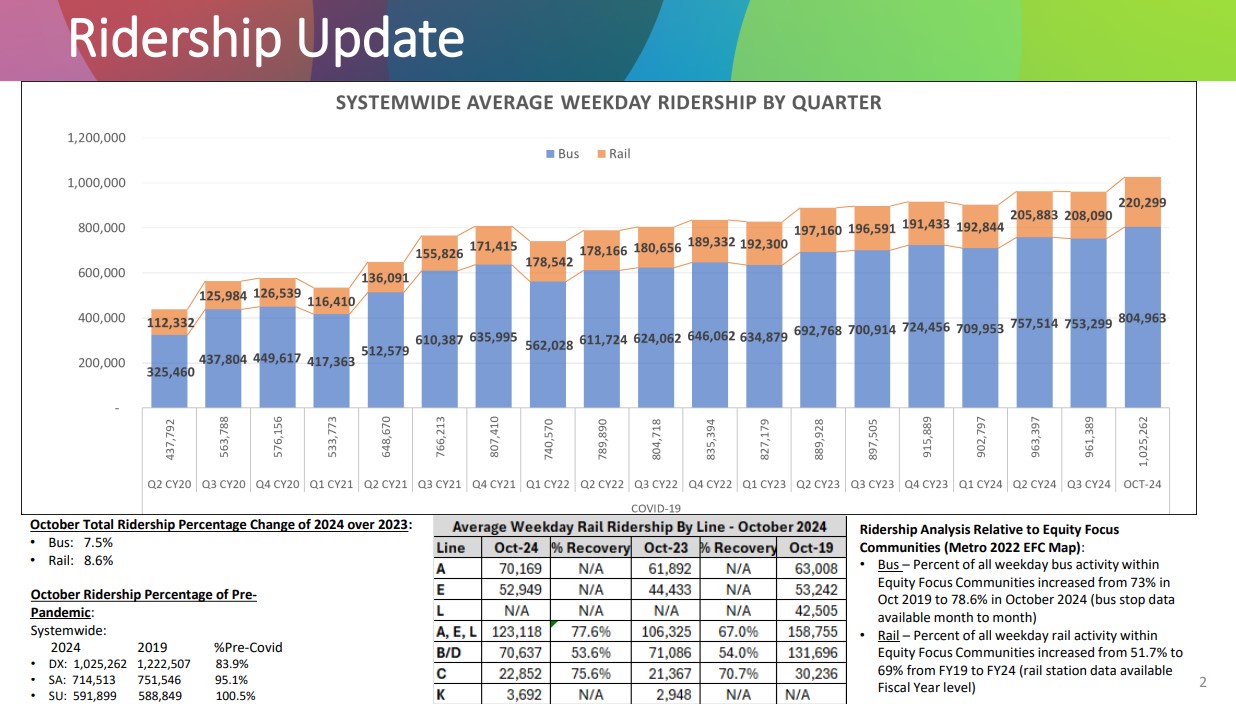
October is the twenty-third consecutive month of year-over-year Metro ridership growth. From October 2023 to October 2024, overall boardings grew 7.8 percent, with bus growth at 7.6 percent and rail at 8.6 percent.
Metro, like many transit operators, struggled somewhat to recover ridership after it declined significantly at the outset of the pandemic. Today, overall Metro transit ridership is at 86 percent of pre-pandemic levels, with weekday boardings at 84 percent and weekend ridership at 97.5 percent.
Weekend ridership has recovered more quickly than weekdays, with many lines exceeding their pre-pandemic Saturday and especially Sunday levels. October 2024 weekend bus ridership was 95.8 percent of (pre-pandemic) October 2019 ridership. October 2024 weekend rail ridership was 3.1 percent higher than in October 2019 (during that time Metro’s rail system expanded with Regional Connector and K Line openings in 2023 and 2022, respectively).
Metro light rail and Bus Rapid Transit lines all saw strong year-over-year growth in October.
Below are the overall October 2023 ridership totals and percentage changes since October 2022:
- A Line (former Blue/Gold) light rail: 2,018,755 – grew +13.3%
- B/D Lines (former Red/Purple) heavy rail: 2,013,539 – lost -1.74%
- C Line (former Green) light rail: 642,992 – grew +7.1%
- E Line (former Gold/Expo) light rail: 1,521,235 – grew +18.5%
- G Line (former Orange) BRT: 415,027 – grew +4.69%
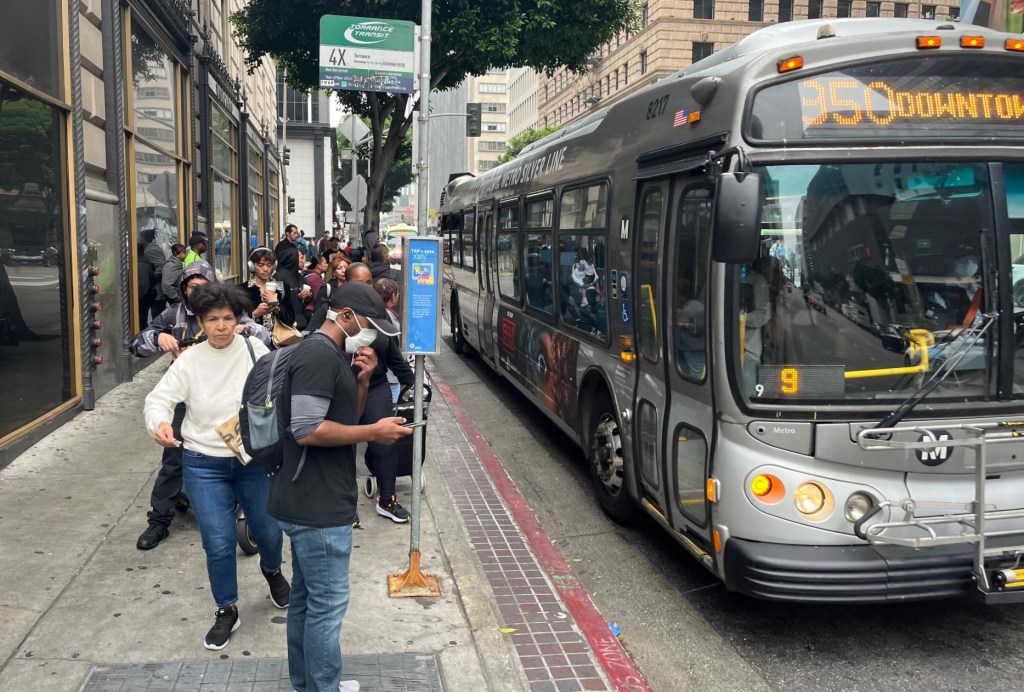
- J Line (former Silver) BRT: 486,359 – grew +10.63%
- K Line light rail: 111,284 – grew +22.97%
Notice in the list above that while ridership increased nearly across the board (bus, rail, weekday, weekend), Metro’s workhorse B/D Line heavy rail subway ridership declined slightly. B/D ridership has been roughly flat for a couple of years, at roughly two-thirds of pre-pandemic boardings.
One trend some transit watchers have noticed is that, earlier this year (April 2024), A Line ridership surpassed the B/D Lines for the first time in at least two decades.
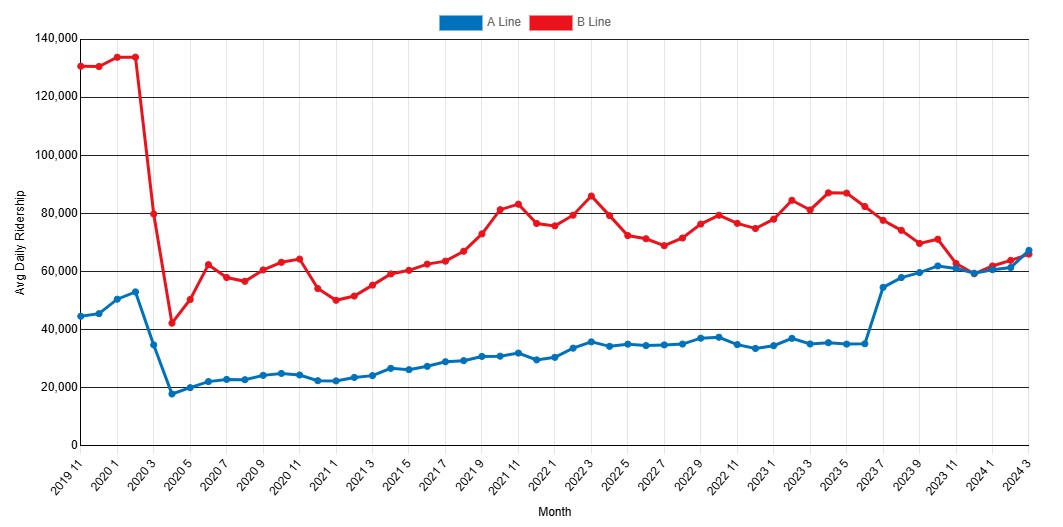
The A Line roughly doubled in length in 2023 when the Regional Connector combined the Blue and Gold Lines. The connector has greatly benefitted Metro riders, but it shifted some former B/D Line trips to the A and E Lines. (Prior to the connector, many A and E Line trips needed transfers to the B/D Line trunk downtown. The connector smartly eliminated these transfers.)
B/D ridership has also perhaps been most impacted by increased remote work, homelessness, and (actual and perceived) crime. Metro has been responding to the latter issues by increasing homeless services, ambassadors, law enforcement, and more. These interventions have been a mix of positive and punitive measures.
The overall ridership news continues to be very very positive. More and more Angelenos are riding Metro. You’re probably already seeing more folks on your buses and trains.
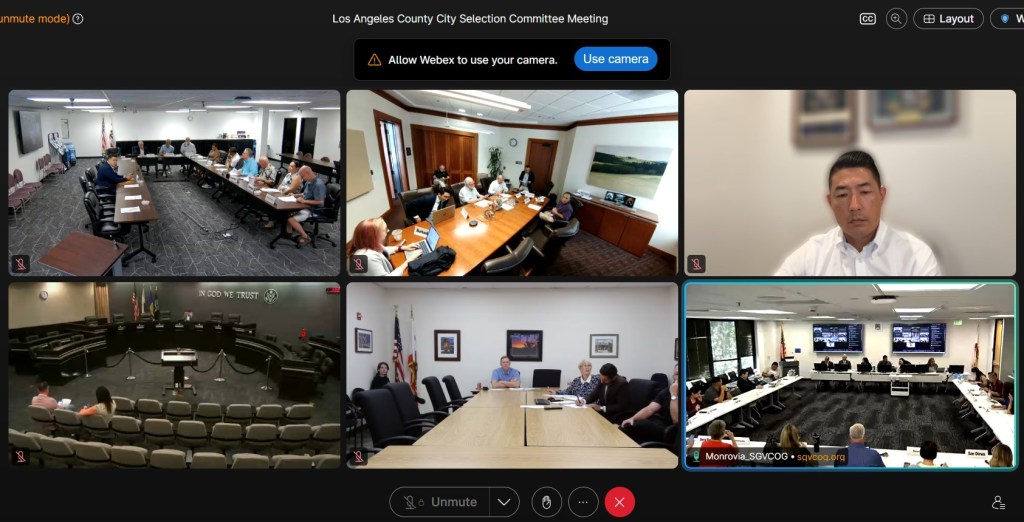
For more information, see also recent SBLA coverage of September ridership statistics and analysis of factors contributing to the recent high growth lines. For Metro ridership statistics, see Metro’s ridership data webpage and monthly Chief Operating Officer presentations delivered at Metro Operations Committee meetings (this is today’s).

Read More:
Streetsblog has migrated to a new comment system. New commenters can register directly in the comments section of any article. Returning commenters: your previous comments and display name have been preserved, but you'll need to reclaim your account by clicking "Forgot your password?" on the sign-in form, entering your email, and following the verification link to set a new password — this is required because passwords could not be carried over during the migration. For questions, contact tips@streetsblog.org.