Metro Ridership Keeps Growing; August Boardings Set Pandemic-Era Weekend Records
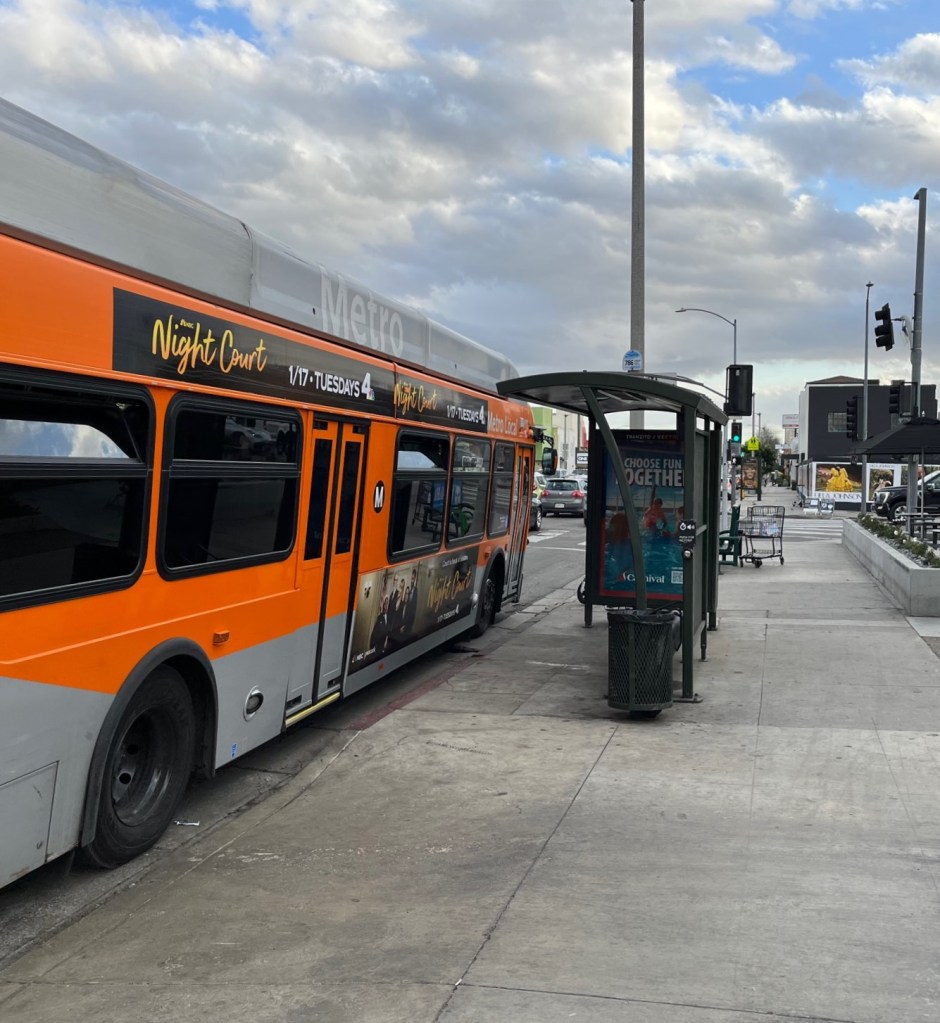
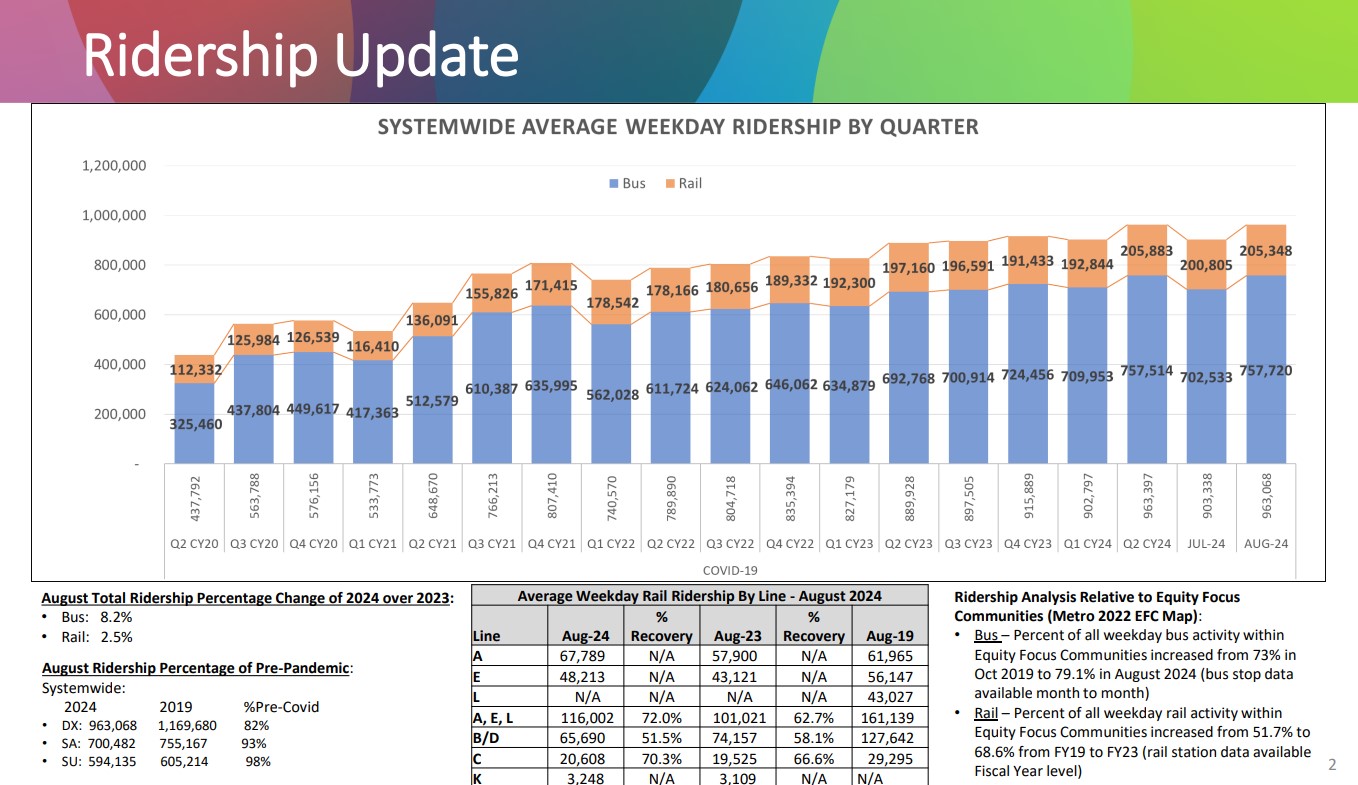
After taking a significant dip at the outset of COVID, Metro transit ridership has been steadily recovering. New figures released today show that Metro averaged 963,068 daily weekday boardings in August 2024.
Metro cut service in 2020, then fully restored bus service in late 2022. In 2023, Metro restored heavy rail service and restored and expanded light rail service. Metro transit ridership steadily grew throughout 2023 and through mid-2024. Both bus and rail ridership are up, though bus boardings are recovering more quickly and more fully than rail.
Metro August and July ridership were the twenty-first and twenty-second twentieth and twenty-first months of year-over-year ridership increases.
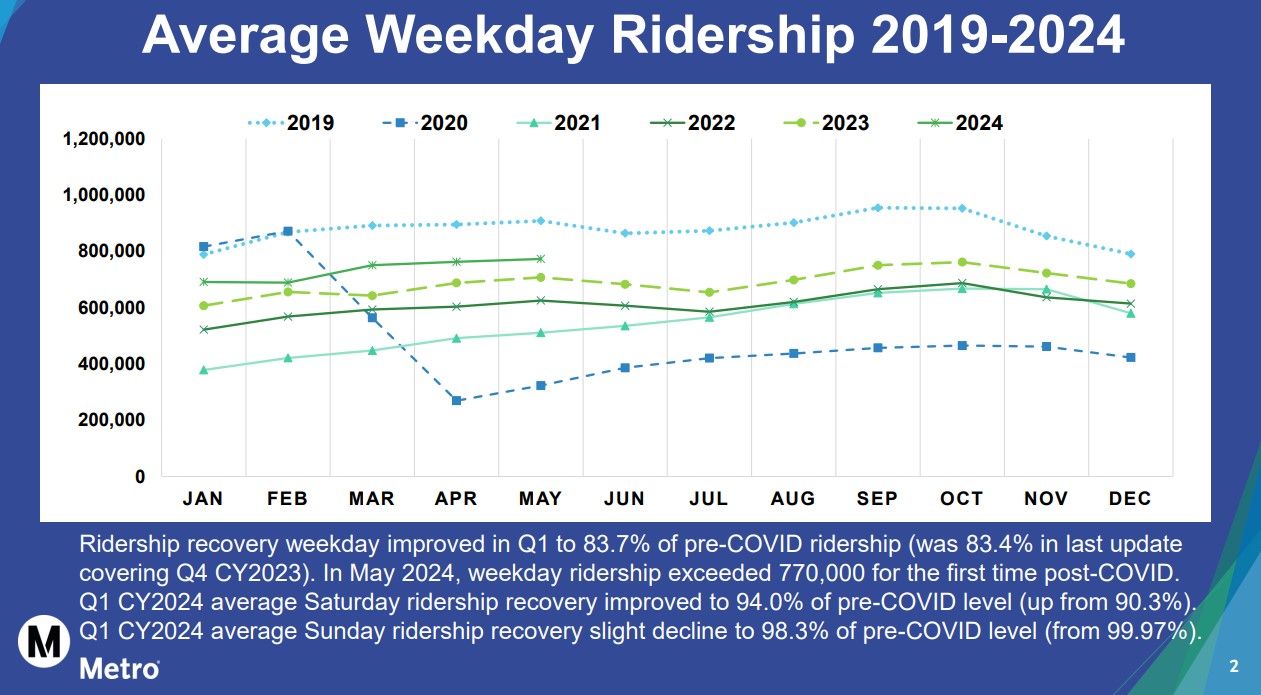
Ridership varies seasonally, typically with slight dips in summer and winter months.
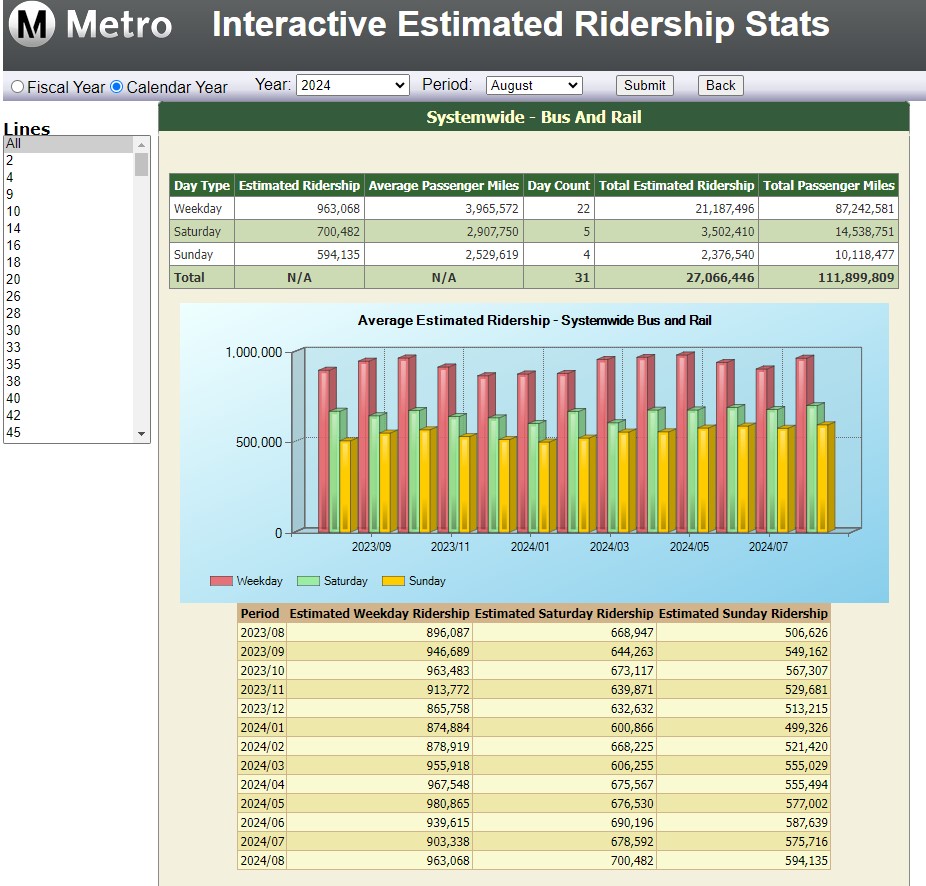
Metro hit a pandemic-era ridership record in May with 981K daily boardings. August 2024’s 963K was the fourth highest weekday ridership month since 2020, with record Saturday and Sunday ridership.
September and October appear likely to break the million daily boardings mark.
For additional Metro ridership statistics, see also today’s NextGen Ridership Update (staff reports, presentation), which includes comparisons between subregions, times of day, and other ridership statistics – through May 2024.
Corrected 10/2 – SBLA erroneously reported this as the 21st and 22nd month of year-on-year growth, but it was the 20th and 21st.

Streetsblog has migrated to a new comment system. New commenters can register directly in the comments section of any article. Returning commenters: your previous comments and display name have been preserved, but you'll need to reclaim your account by clicking "Forgot your password?" on the sign-in form, entering your email, and following the verification link to set a new password — this is required because passwords could not be carried over during the migration. For questions, contact tips@streetsblog.org.