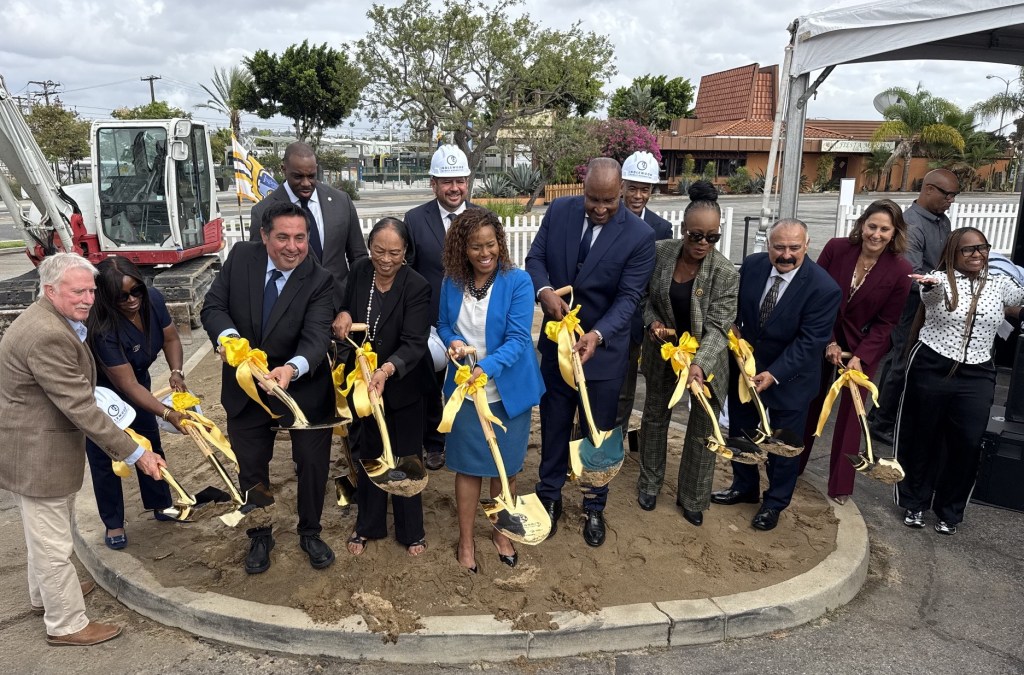
Nine Districts Have Seen Zero Repaving This Year. How Does Yours Measure Up?

(Disclaimer: I, Streetsblog Editor Joe Linton, do not claim to be a neutral observer here. Outside of my Streetsblog reporting, I have repeatedly challenged city inaction on Measure HLA. I am fighting for HLA in court and at the Board of Public Works. I don’t have a financial stake in this, but am an interested party in Measure HLA matters.)
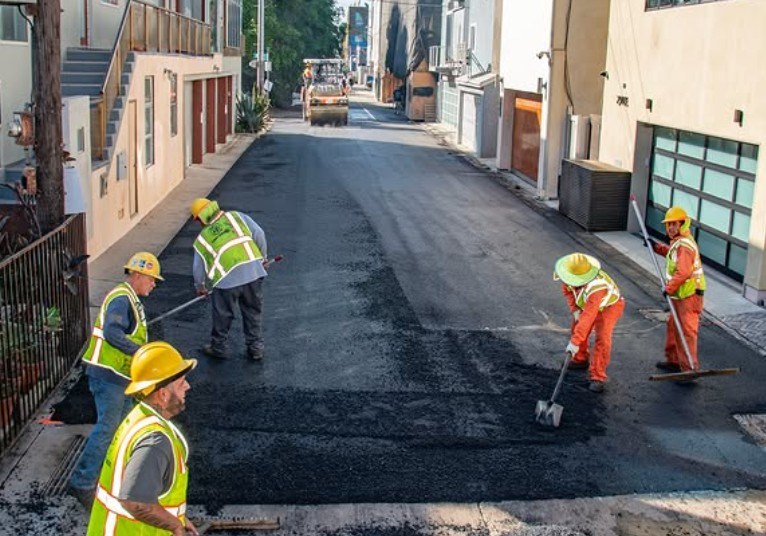
L.A. City resumed resurfacing streets after a hiatus, but right now the work completed appears unfair and inequitable. The city’s own reporting shows that most L.A. City council districts have seen no repaving at all since July 1. Some districts haven’t had a single block resurfaced since mid-2025.
Some Recent History Affecting City Repaving
In March 2024, L.A. City voters approved Measure HLA, designed to install planned walk/bus/bike improvements when the city repaves or reconfigures streets.
The city has implemented relatively few walk/bus/bike improvements since HLA became law. In order to avoid multimodal improvements, the city repeatedly changed which streets it repaves. As soon as HLA took effect in April 2024, the city essentially paused repaving streets where improvements were planned. In July 2025, the city paused all repaving, instead shifting to costly partial resurfacing termed “large asphalt repair” [video]. In March 2026, the city again changed its repaving process, cutting way back on “LAR” and resuming full curb-to-curb resurfacing, focused heavily on resurfacing smaller streets without sidewalks [video part 1, part 2].
See earlier SBLA reporting for a detailed Measure HLA timeline through March 2026, when HLA turned two.
Analysis of Recent Resurfacing
The city Public Works Department Bureau of Street Services (StreetsLA) does street resurfacing. The StreetsLA website lists the bureau’s accomplishments, including a list of completed resurfacing projects. As of October 1, StreetsLA had reported current fiscal year resurfacing segments for the months of July and August. Historically, StreetsLA also mapped resurfacing – but the current map does not yet display FY26-27 resurfacing data.
Streetsblog L.A. copied the July-August completed resurfacing list, then added measurements and location details. Find the StreetsLA data and SBLA analysis at this Google spreadsheet. This post breaks down those two months of data to show where StreetsLA has focused its resurfacing resources so far during the current fiscal year.
The first observation is that StreetsLA has continued last year’s practice of repaving streets without sidewalks. Of 96 resurfacing projects completed this fiscal year, three were on streets with sidewalks. No resurfacing was reported on any street more than 40 feet wide.
As SBLA has reported, these smaller no-sidewalk residential streets tend to be more well-off, single-family residential streets, many in hillside areas – and this is borne out by the latest data.
Resurfacing by Council District
L.A. City is divided into 15 City Council districts [map] with roughly equal population. If resurfacing were evenly distributed throughout the city, each district would see 6-7 percent of the overall total.
So far this year, just six districts received any resurfacing at all. Councilmembers Traci Park and John Lee each received about 20% of StreetsLA resurfacing. Park represents L.A.’s largely well-off Westside areas, west of the 405 Freeway. Lee represents the mostly suburban northwest San Fernando Valley.
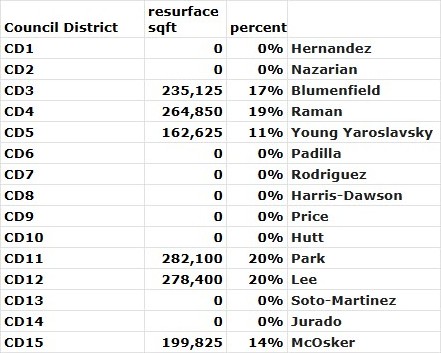
Those two front runner districts were followed by Councilmembers Nithya Raman (19%), Bob Blumenfield (17%), Tim McOsker (14%) and Katy Yaroslavsky (11%).
Resurfacing in Raman’s district is located on both sides of the Santa Monica Mountains, in neighborhoods including the Hollywood Hills and Encino. Blumenfield’s projects are in the suburban southwest Valley, primarily in Woodland Hills.
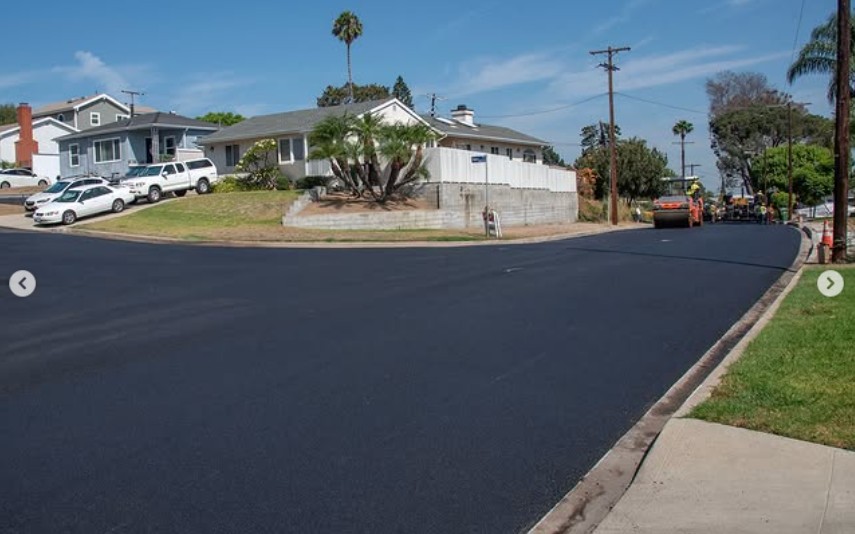
In McOsker’s Watts-to-San-Pedro 15th Council District, resurfacing is nearly all in one sidewalk-less suburban tract bordering Lomita, very near Palos Verdes. Yaroslavsky’s resurfacing is entirely in tony Bel-Air.
For the two months data available – July and August – StreetsLA reported no resurfacing in nine districts, those represented by Eunisses Hernandez, Adrin Nazarian, Imelda Padilla, Monica Rodriguez, Marqueece Harris-Dawson, Curren Price, Heather Hutt, Hugo Soto-Martinez, or Ysabel Jurado.
Council districts 6, 8, 10, and 13 – represented by Padilla, Harris-Dawson, Hutt, and Soto-Martinez respectively – have not had a single block of street fully repaved since prior to July 2025. Streets in these districts have had only slurry seal (an asphalt maintenance/sealing treatment) and “large asphalt repair.”
Resurfacing by Neighborhood
The breakdown by neighborhood displays similar trends toward well-off residential areas. The top five resurfacing neighborhoods were: Northridge, Bel-Air, Harbor City, Brentwood, and Hollywood Hills West. Each of these neighborhoods received more than 10% of city resurfacing (by area) so far in fiscal year 2026-27.
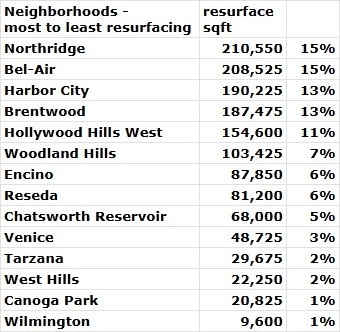
Bel-Air, a well-off hillside neighborhood that’s home to about 8,700 people (less than half of one percent of the city’s nearly 3.9 million people), received about 15 percent of city resurfacing in July/August. Brentwood (population ~40,000 – about one percent of L.A. population) accounted for 13 percent of resurfacing. Both of those neighborhoods also received a disproportionate share of resurfacing last fiscal year since resurfacing resumed in March (see StreetsLA spreadsheet).
Consequences of HLA Linking Resurfacing and Improvements
Measure HLA mainly triggers street improvements based on which blocks the city resurfaces. This makes improvements somewhat random (more on this below), and not based on more strategic factors like high injury locations, pedestrian/wheelchair traffic, network gap closures, bus ridership, etc.
HLA’s premise is that, over time – over several decades – resurfacing gradually gets around to all streets – resulting gradually in planned upgrades implemented all over. The calculus is that somewhat random implementation is better than nothing – or next to nothing (better than the city’s past decade of very little implementation).
A flaw in HLA’s approach is that the city’s resurfacing has never been random. It has never been equitably distributed. Streets in well off neighborhoods are in better condition than streets in low-income communities of color. Before and after HLA, resurfacing benefited communities like Bel-Air and Brentwood more than it did Watts and Westlake.
What the last few months’ worth of data show is that, to avoid ADA and HLA, the city chose to make already-inequitable resurfacing even worse. City leaders (mainly StreetsLA leadership and elected councilmembers) choose what streets to pave. So far this year, their choices have continued to enrich the rich and further impoverish the underserved.
In sum, the city’s choices haven’t served anyone well. The decision to focus resurfacing on small streets has allowed many larger streets to degrade. Everyone – including drivers, bus riders, wheelchair users, cyclists, pedestrians, etc. – is experiencing cracked potholed surfaces on medium- and larger-sized streets. It feels like city leaders, when told by voters to change the way they approached streets – to make streets more inclusive and more accessible – instead decided to make L.A. streets worse for everybody.
Some people may blame Measure HLA for the current situation. Though HLA (and ADA law changes) precipitated changes, city leadership is making choices that shape those changes.
HLA proponents expected that resurfacing would continue more or less the way it had for past decades. They clearly did not anticipate that the city’s response to voters expressing support for more bike and bus lanes would be to cease most resurfacing in order to install fewer bike and bus lanes. No one foresaw that the city would stop all street resurfacing for eight months (June 2025 to mid-March 2026) during its “large asphalt repair” binge. These are major changes made quietly by StreetsLA leadership, with the acquiescence of the council and the mayor.
In testimony to Council – earlier this year and dating back to mid-2024 – StreetsLA and LADOT leadership have pledged that together they will come up with a work plan to jointly deliver HLA projects. But it has been more than two and a half years since HLA became law, and no city plan has ever been shared. Instead the departments have jointly neglected larger city streets, and curtailed installations of new bus lanes and new bike lanes.
City leadership needs to roll up its sleeves, and craft a healthier response. The current heel dragging serves all Angelenos badly and fails to rise to crises of traffic violence, inequity, climate, and more.
Notes on methodology
Streetsblog started with the StreetsLA list, then measured each resurfacing project’s length and width using Google Maps. Those measurements were used to calculate area. Streetsblog did not check the exact on-the-ground conditions for all 96 locations. This method should yield a fairly accurate approximation – within a few percent – but it is not accurate to the square foot.
Neighborhood boundaries are from the L.A. Times Mapping L.A.
Streetsblog has migrated to a new comment system. New commenters can register directly in the comments section of any article. Returning commenters: your previous comments and display name have been preserved, but you'll need to reclaim your account by clicking "Forgot your password?" on the sign-in form, entering your email, and following the verification link to set a new password — this is required because passwords could not be carried over during the migration. For questions, contact tips@streetsblog.org.