It's the new L.A. City fiscal year, so time for Streetsblog L.A.'s annual look at the past year's bikeway implementation.
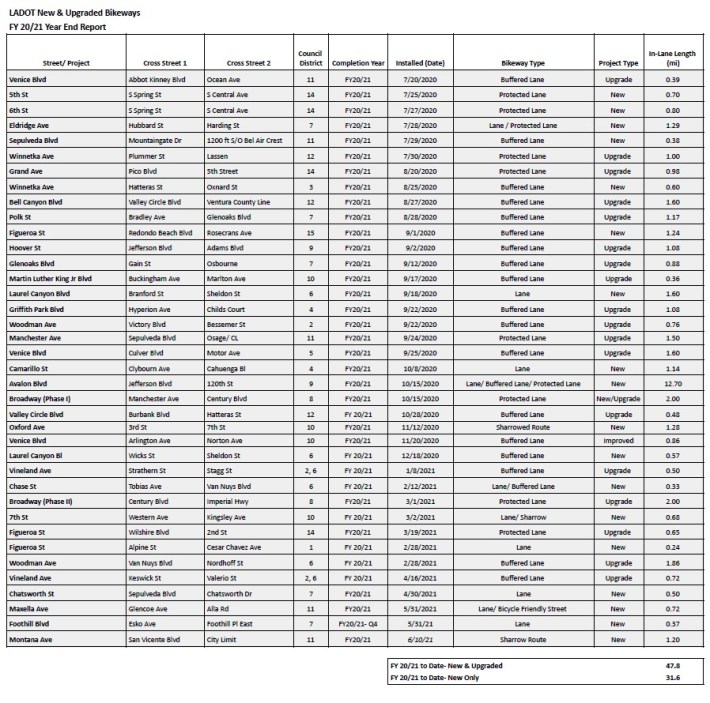
At the end of each fiscal year, LADOT typically publishes its annual report which includes bikeway mileage completed. LADOT recently provided Streetsblog a spreadsheet showing Fiscal Year 2020-21 bikeway implementation.
Under Mayor Antonio Villaraigosa, LADOT new bikeways peaked at 200+ new bikeway lane-miles annually. Since Mayor Eric Garcetti took office in 2013, bikeway mileage implementation has fallen dramatically. Early on, Garcetti's LADOT GM Seleta Reynolds signaled that the department would focus on bikeway quality over quantity. Under Reynolds' leadership, several quality bikeways have been implemented, but, overall, new bikeway mileage has been dismal, meaning that the city's inadequate network has remained inadequate. Reynolds has been hampered by many City Councilmembers - Gil Cedillo, Paul Koretz, Curren Price, David Ryu, Mitch O’Farrell, and Paul Krekorian - who have canceled planned bikeway projects in their districts. In LADOT's 2021 Strategic Plan Update, the department all but confessed to having surrendered to pro-car forces, only committing to "Complete one major active transportation project (such as a protected bike lane on a major street) per year."
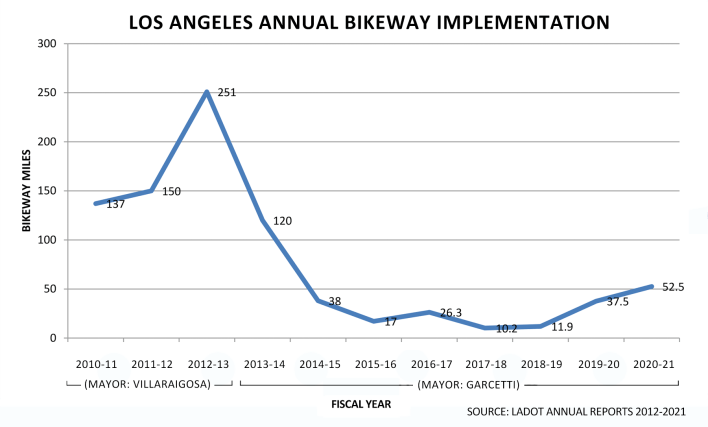
Overall bikeway implementation is up over the past year. For FY2020-21, L.A. City saw 51.5 lane-miles of upgraded and new bikeways. (Streetsblog's totals differ slightly from those reported by LADOT, which underreported totals - see SBLA spreadsheet for details on discrepancies. SBLA numbers are used throughout this article.)
The 51 mile total compares favorably to the last six fiscal years, when annual mileage was between 10 and 40 miles.
As SBLA noted in past fiscal year mileage posts, not all bikeway miles are equal. Quality protected bikeways and paths serve riders aged 8 to 80; sharrows are such a weak treatment as to serve almost nobody. New bikeway mileage expands the network, while upgrades to existing bikeways do not. Among upgrades, some are significant (converting unprotected lanes to protected ones) and others are minor (adding a buffer to an existing lane.)
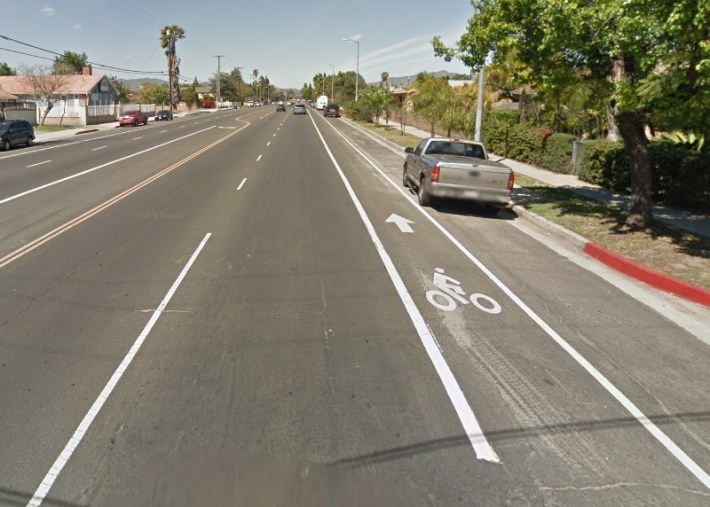
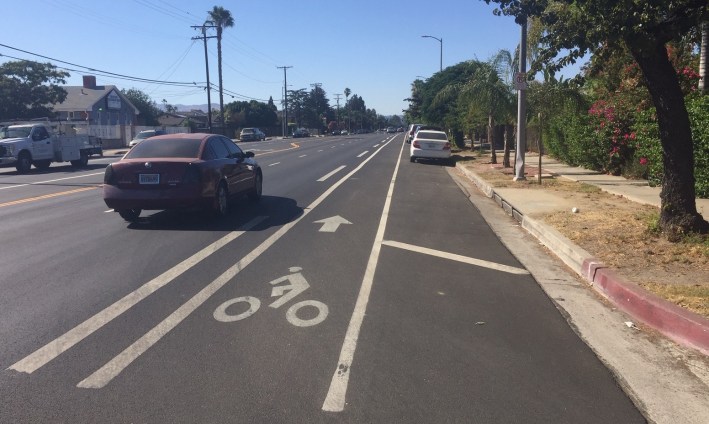
In many cases, upgrades point to LADOT's failure to install the safest and best improvements at the outset. Also, many upgrades allow the city to double- and triple-count mileage on a street as it first gets, say, sharrows, then a bike lane, then a buffered bike lane, then a protected bike lane.
LADOTs FY20-21 total of 52.5 miles breaks down into 31.8 miles of new bikeways and 20.6 miles of upgrades to already existing bikeways. Last year there were 18.5 new lane-miles and 18.2 miles of upgrades.
Among the new bikeways are:
- no paths
- 7.4 miles of new protected lanes (23 percent)
- 11.1 miles of new buffered lanes (35 percent)
- 8.3 miles of new conventional lanes (26 percent)
- 4.9 miles of new sharrowed routes (16 percent)
As SBLA noted last year, it is informative to look at two measurements of relatively good quality facilities:
- New Lane Miles - new bike lanes (conventional, buffered, or protected) and paths. This year LADOT installed 26.9 new lane miles - more than double last year's total (11.3 miles) and about five times the prior year (4.7 miles).
- Significant Upgrades – upgrades that add protection to existing unprotected bike lanes. This year LADOT upgrades added protection to 7.8 miles of bike lanes - roughly the same as last year (8.7 miles) both more than double the year before (about 4 miles).
So, FY20-21 saw ~52 total miles (with ~34 quality miles) which is quite a bit more than last year's ~37 total miles (with ~20 quality miles).
The past two years represent a welcome increase over the dismal totals under earlier Garcetti/Reynolds years. While not quite a portrait in courage (or an adequate response to a climate crisis that calls for big shifts in transportation), thirty-plus quality bikeway miles is an important accomplishment.
What accounts for the increase?
Fiscal year 20-21 saw the city responding to the COVID pandemic. As observed last year, this resulted in an increase in bikeway implementation due to the city having relaxed repaving of residential streets and stepped-up repaving of arterials, under a Streets L.A. program called ADAPT. Most on-street bikeways are on these busier arterials, so, with repaving, many of these streets received bike upgrades. The vast majority of new and upgraded FY20-21 bikeway mileage was located on newly-resurfaced streets.
Another trend making more mileage possible was road diets (space reallocation which removes a car lane - generally to make room for bike lanes). After a Playa Del Rey backlash undid road diet safety improvements there a couple years ago, road diets became relatively rare in the city of Los Angeles. This year, LADOT implemented road diets on: 5th Street, 6th Street, Avalon Boulevard, Broadway, and Eldridge Avenue (as well as very short portions of Camarillo Street and Maxella Avenue.)
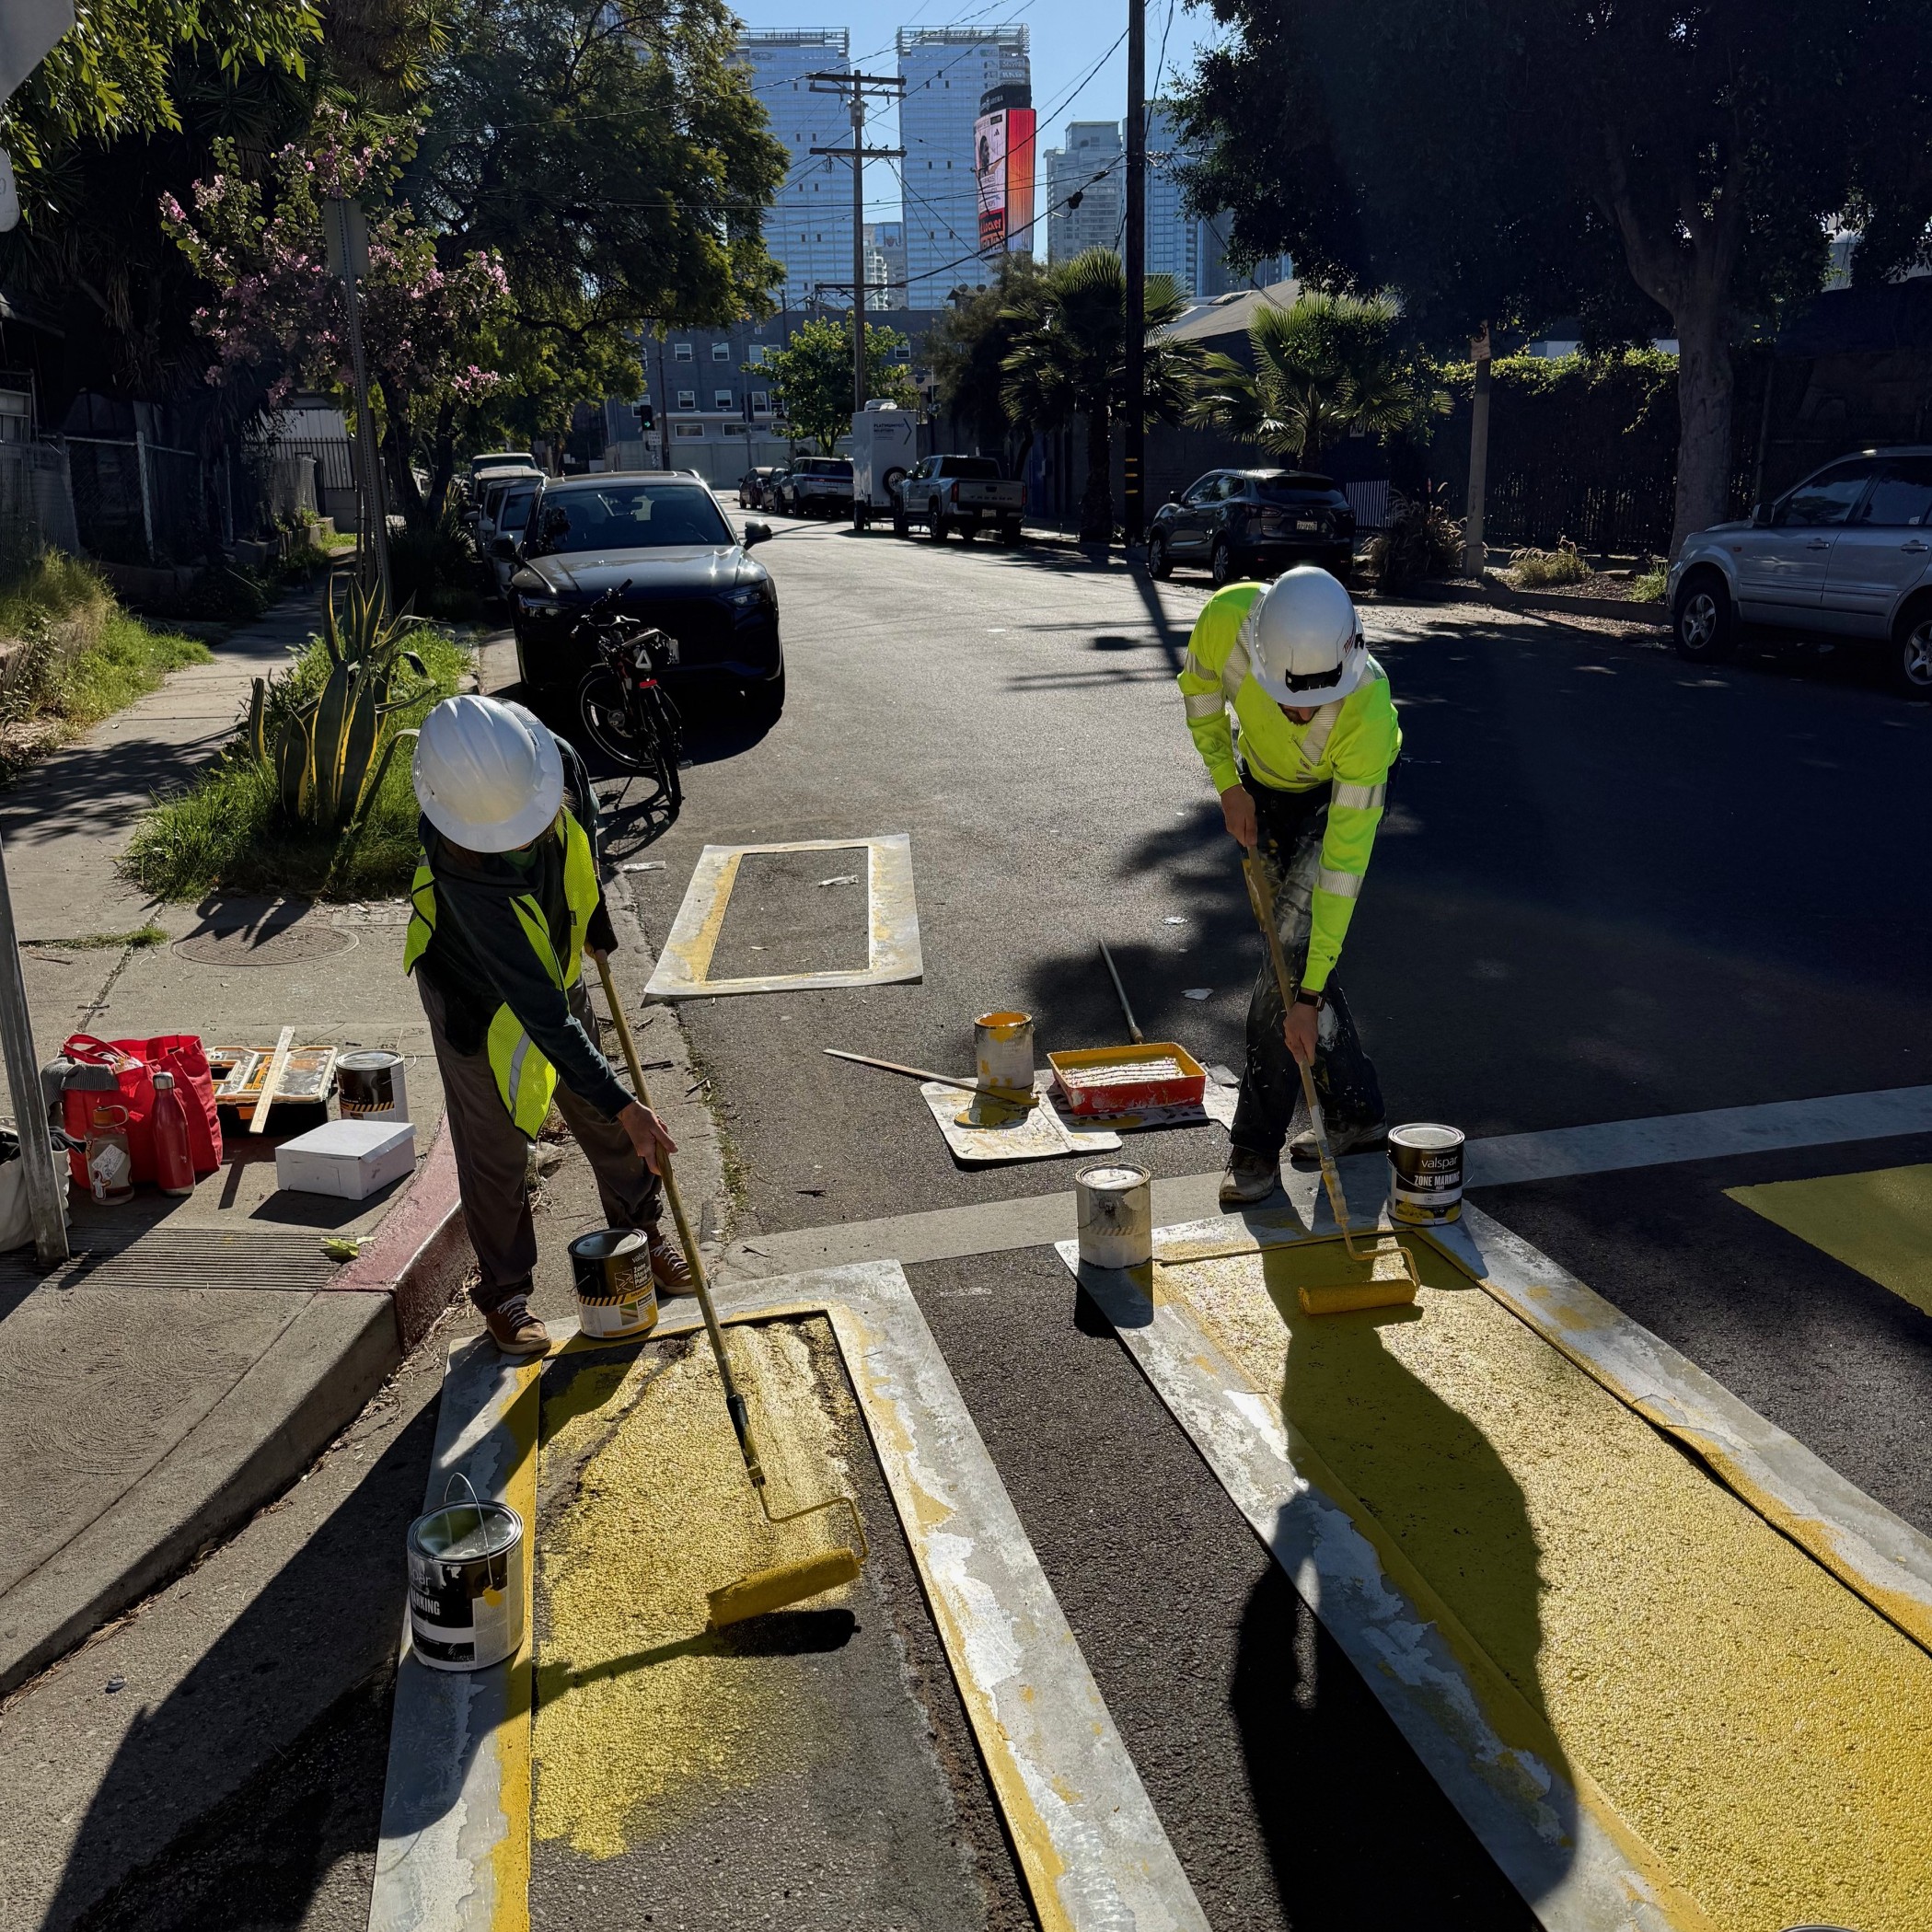
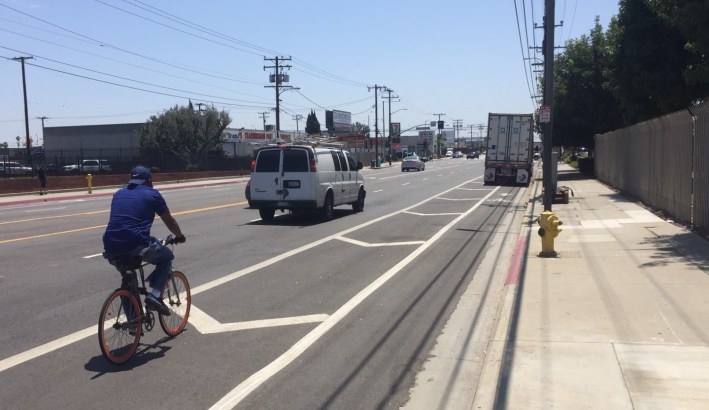
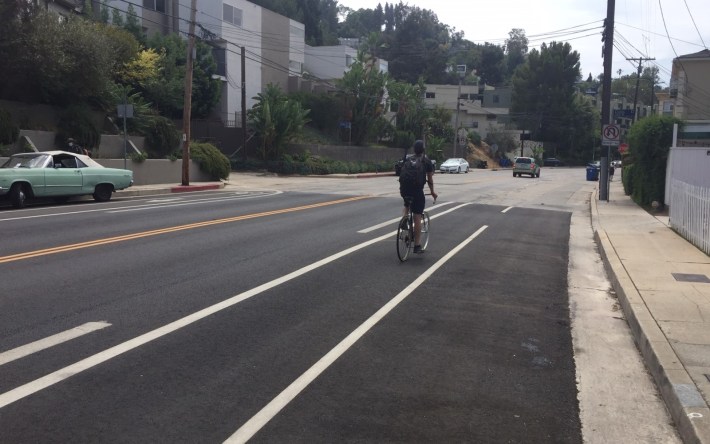
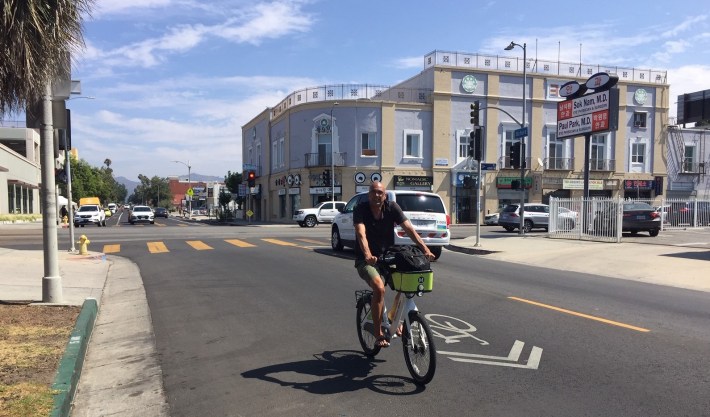
The return of road diets has been made possible by a handful of City Councilmembers willing to use road reconfiguration to solve traffic safety problems. South L.A. Councilmembers Curren Price and Marqueece Harris-Dawson shepherded significant-scale traffic safety improvements on Avalon Boulevard and Broadway, respectively. City Councilmember Monica Rodriguez has quietly supported quite a bit of road reconfiguration and traffic calming in her north San Fernando Valley district, arguably among the most suburban (and even semi-rural) parts of the city. Rodriguez championed road diet reconfigurations on portions of Foothill Boulevard and Eldridge Avenue (both this year - photos below), and La Tuna Canyon Road (in 2018.) She recently called for traffic calming tools to be marshalled to curb dangerous street racing.
Similar to last year's post, below is run-down of many of the city's upgraded and new bikeways - broken down into categories: the good, the meh, and the bad.
The Good
Several of the best of the year's bikeways were touted in earlier Streetsblog posts.
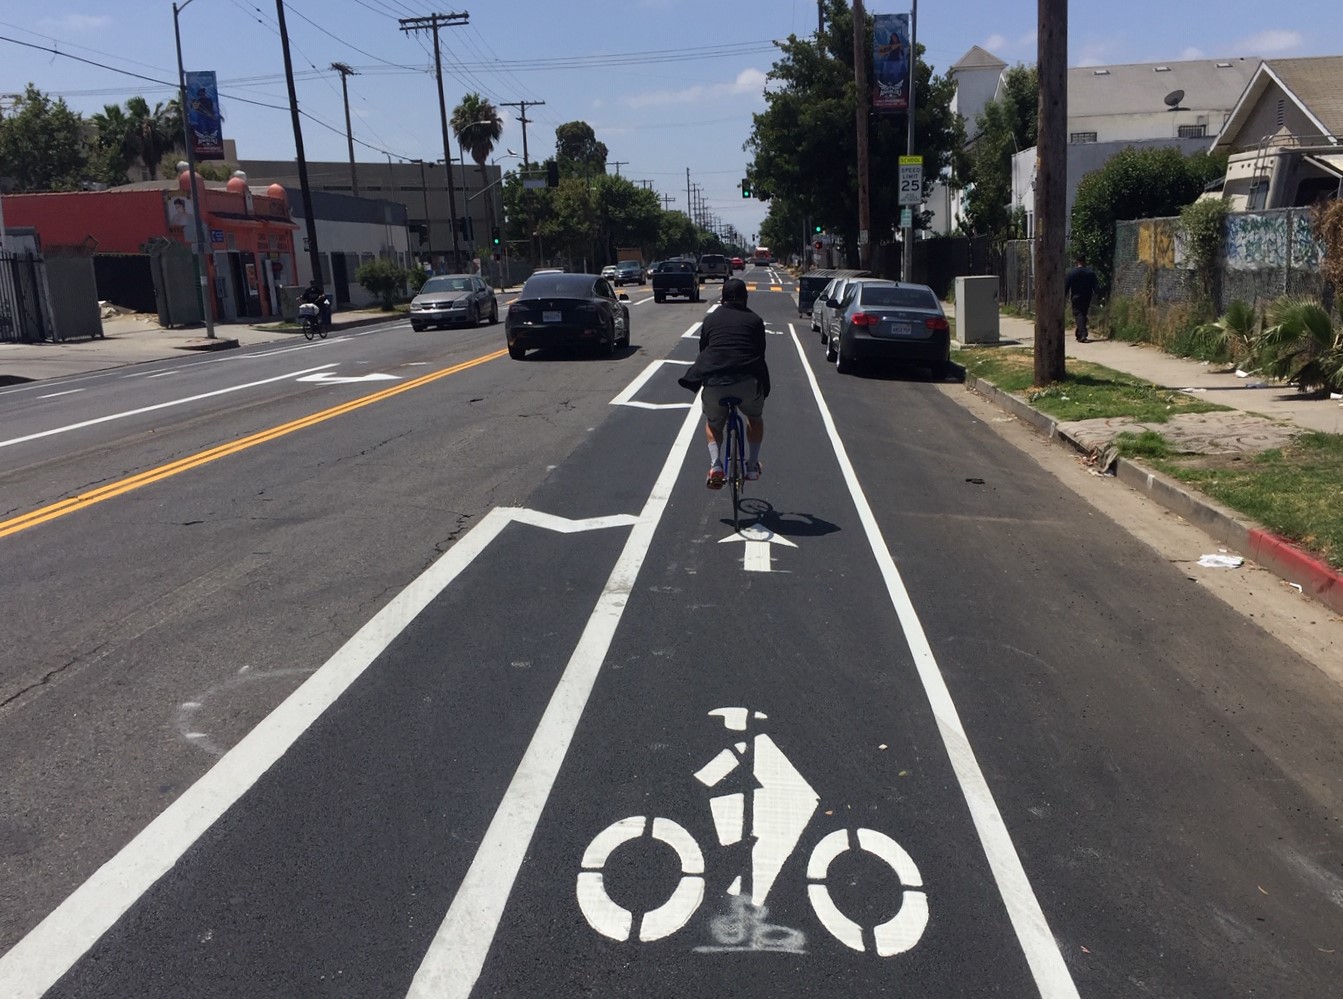
LADOT completed a continuous 6.3 mile stretch (12.7 lane miles) of new bike lanes on Avalon Boulevard in South L.A. The facility extends all the way from Jefferson Boulevard (near downtown L.A.) to 120th Street (just south of the Metro C Line/105 Freeway.) The bikeway was created by removing a travel lane (a road diet.) It's just over half buffered bike lane, with about ten percent protected bike lane.
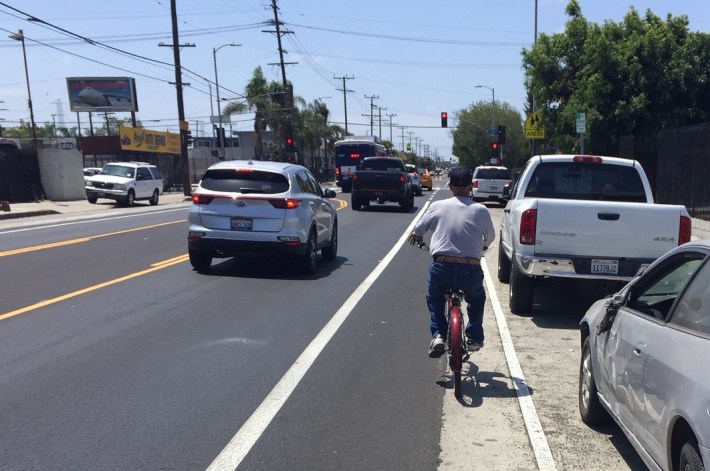
LADOT added new left-side protected bike lanes to the 5th and 6th Streets couplet in downtown L.A. - in response to a campaign for better bike safety for Skid Row cyclists. The bikeways were installed as part of a road diet that added new right-side bus-only lanes.
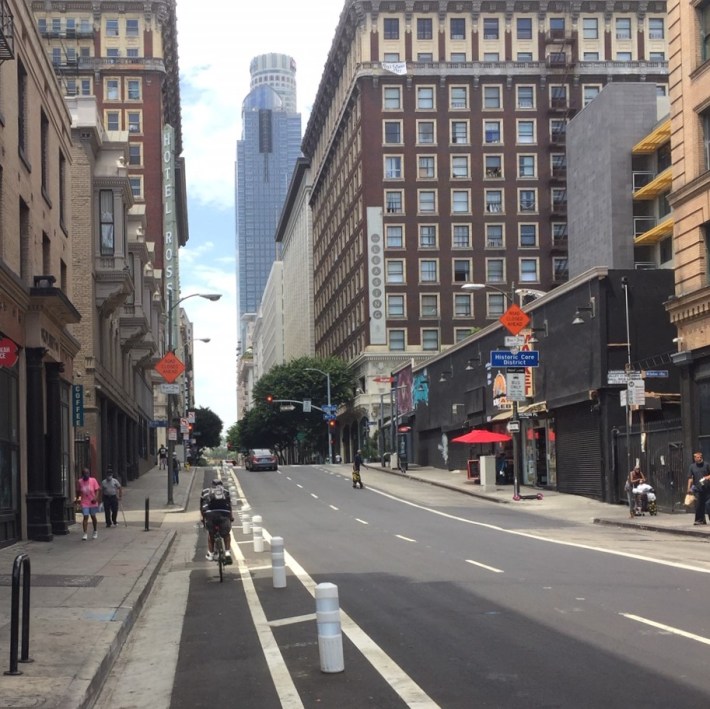
New protection was added to existing bike lanes on other one-way streets - Olive Street, Grand Avenue, and Figueroa Street - in downtown L.A. The lanes on Olive and Grand were smartly moved to the left side - a needed best practice now becoming the norm downtown.
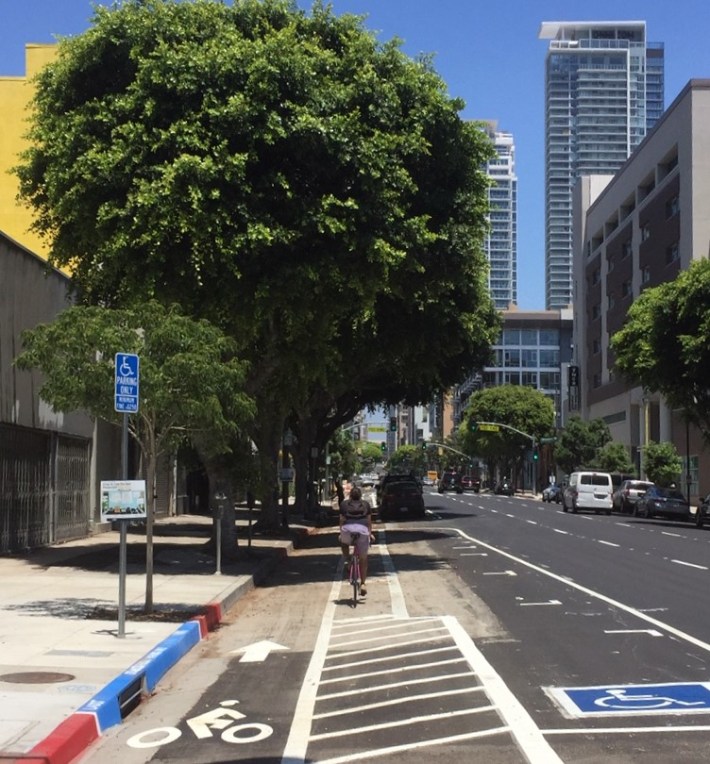
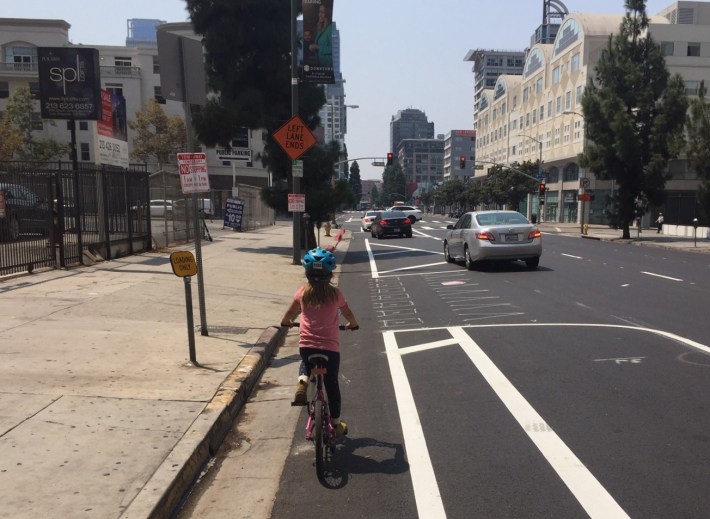
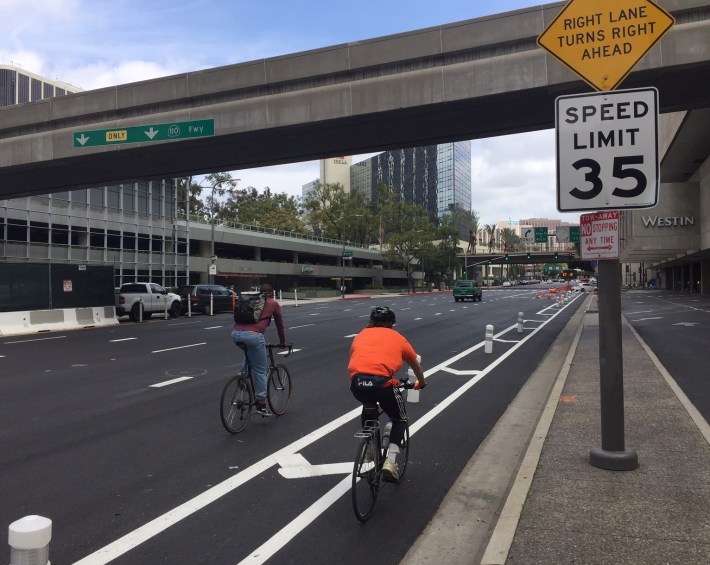
LADOT also installed much needed protected bike lanes outside downtown L.A.: on Broadway (in South L.A.), Eldridge Avenue (in Sylmar), Foothill Boulevard (in Lakeview Terrace), Manchester Avenue (in Westchester), and Winnetka (in Northridge).
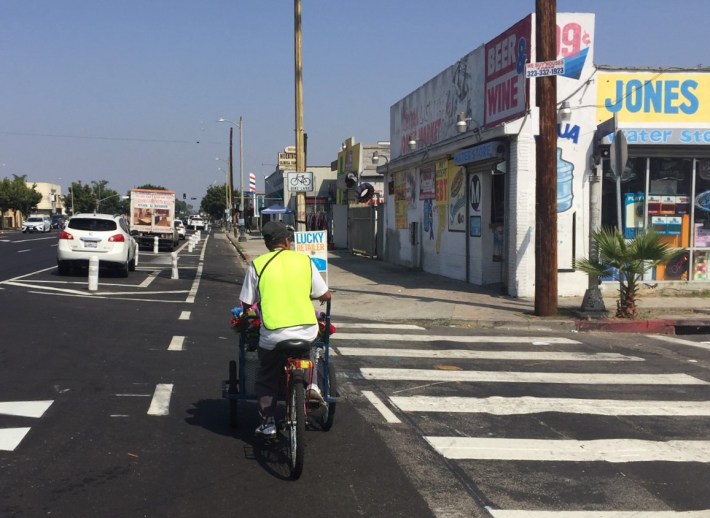
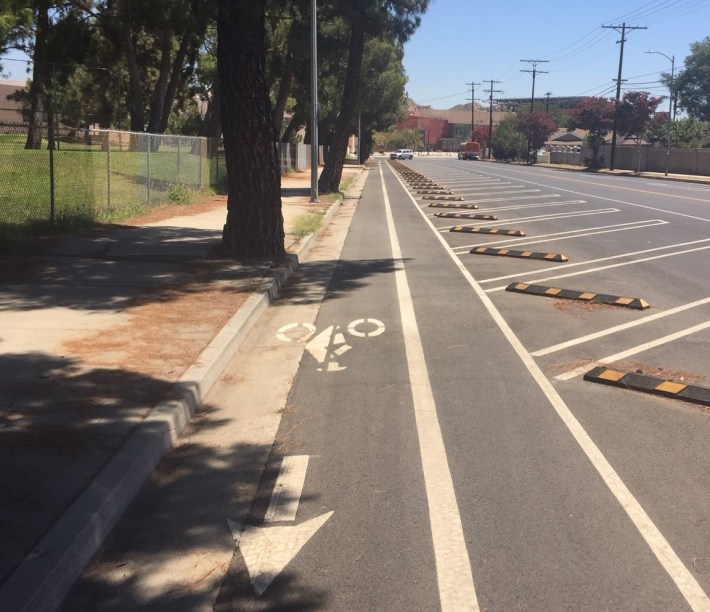
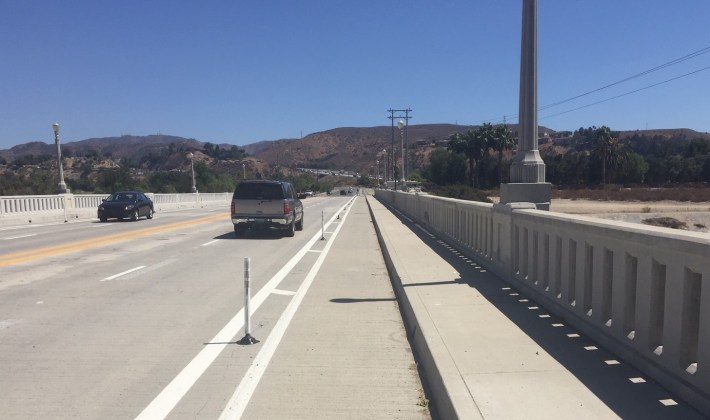
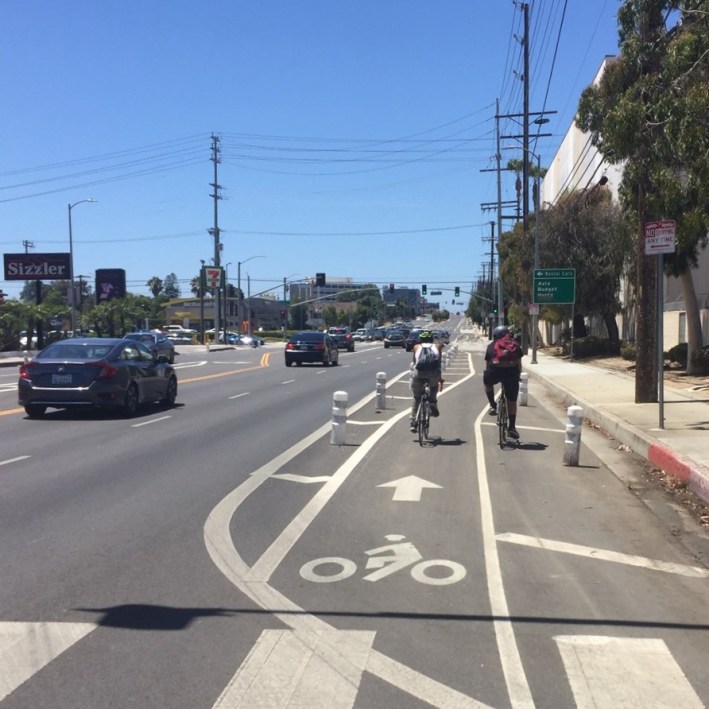
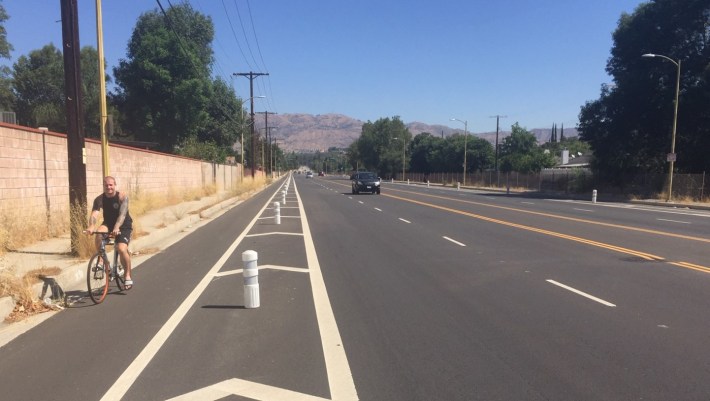
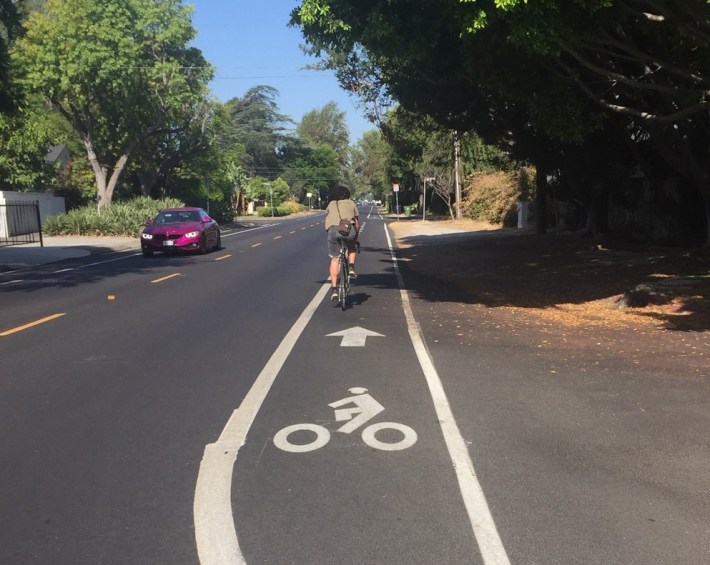
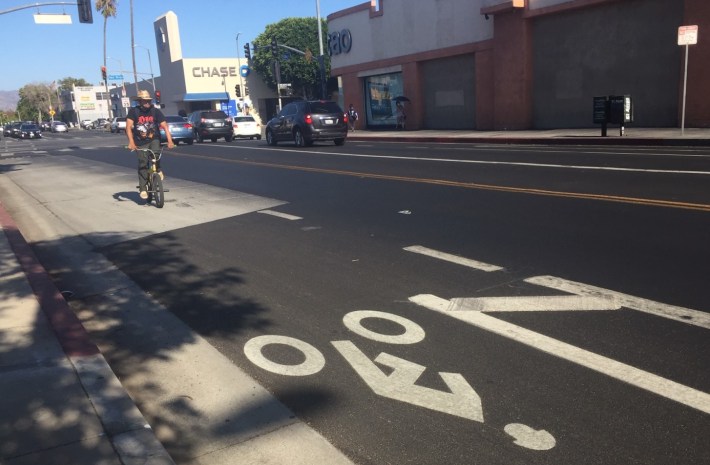
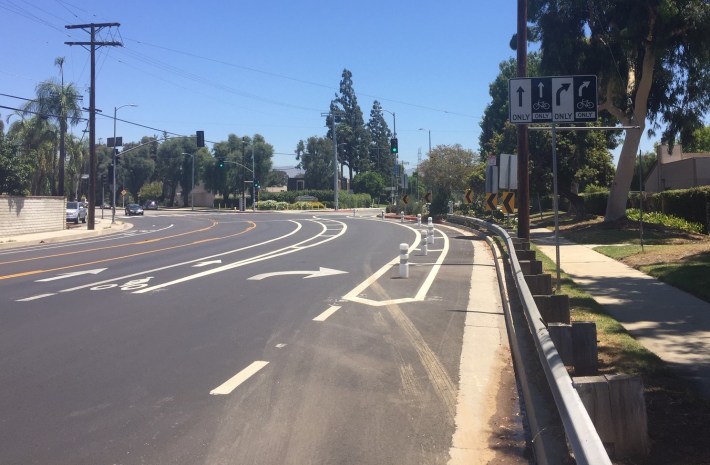
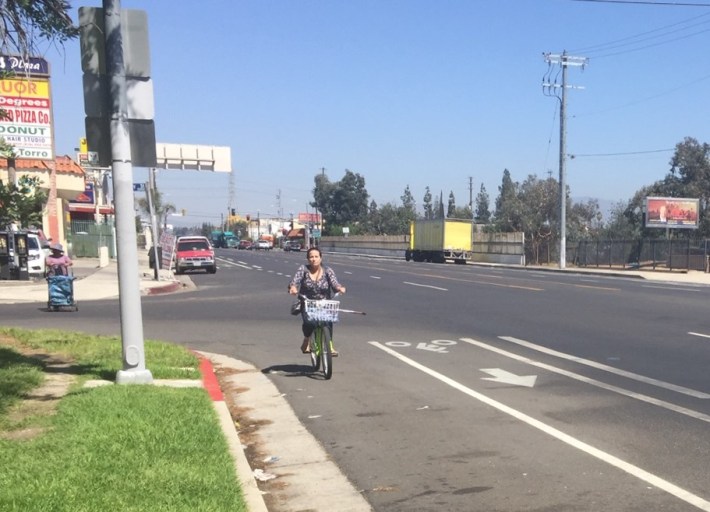
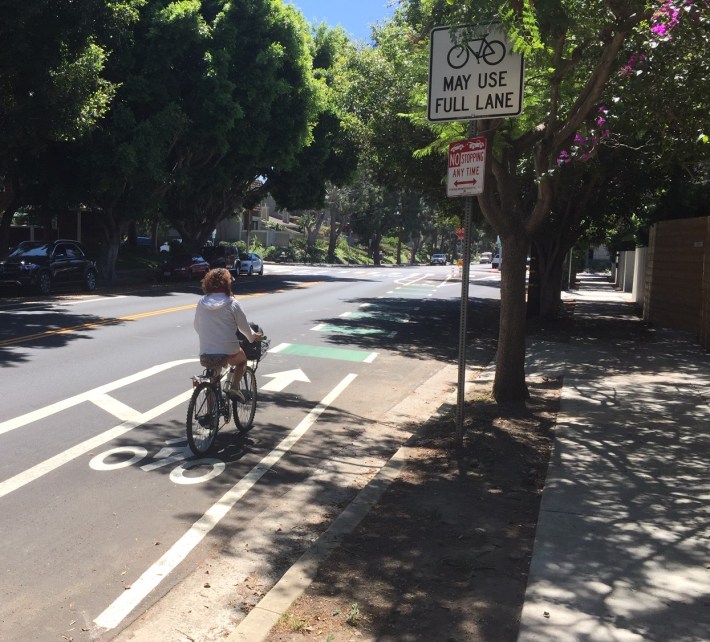
LADOT has continued to add new conventional bike lanes (some buffered), generally on over-wide streets where lanes can be added without removing anything else. These opportunistic facilities are needed, and despite LADOT claims to the contrary for the past decade, there are still scores (arguably hundreds) of miles of these low-hanging fruit opportunities on L.A. City streets. This past year, L.A. added 19.5 miles of new unprotected bike lanes. These included new bike lanes on 7th Street (in Koreatown), Camarillo Street (in Toluca Woods), Chase Street (in Panorama City), Chatsworth Street (in Mission Hills), Figueroa Street (in Chinatown), Figueroa Street (in South L.A.), Laurel Canyon Boulevard (in Sun Valley), and Maxella Avenue (in Del Rey).
The Meh
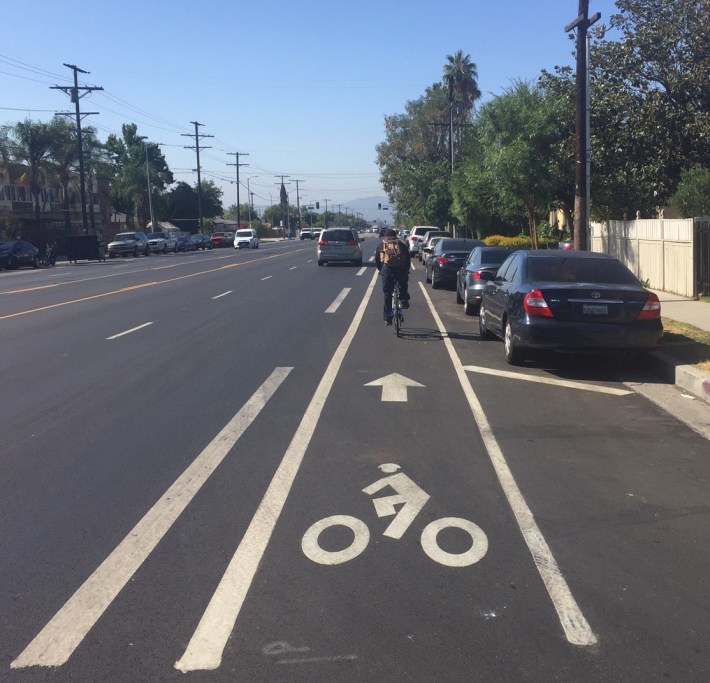
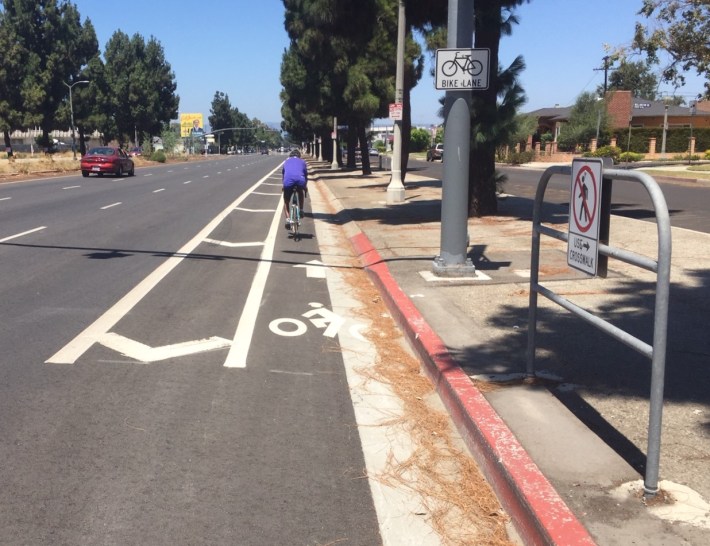
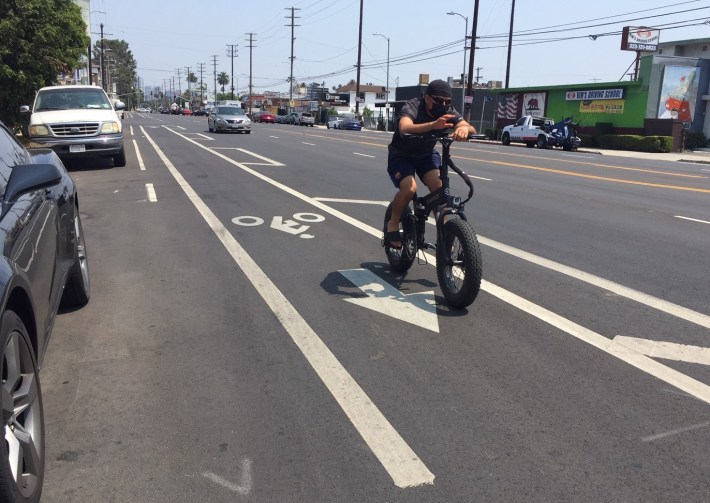
As noted above, nearly a quarter of FY20-21 LADOT bikeway mileage was adding new buffers to existing bike lanes. This minimal upgrade is a very minor step in the right direction - but difficult to get excited about, as it does not extend the city's bikeway network - and does not add protection to existing lanes.
There are a few different types of buffers - a dotted line, a striped-off area, and LADOT debuted a new double-buffer. They all serve to position drivers slightly further from cyclists, but as just paint they don't really keep drivers out of the lane
The Bad
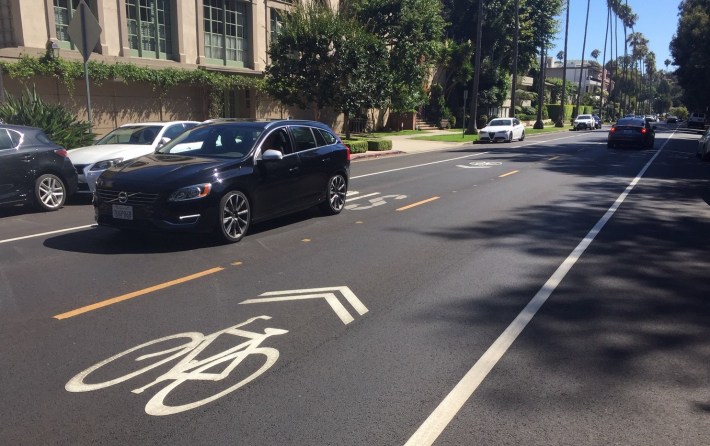
Here is where Streetsblog runs down the sharrows - the worst and wimpiest bike facility treatment. (Note that, in Streetsblog Editor Joe Linton's opinion, LADOT included sharrows in appropriate settings on a couple of bike lane projects this year. On both 7th Street and Figueroa Street facilities noted above, new bike lanes drop for short stretches at narrow pinch points. Rather than completely ending the bikeway, LADOT employed a minimum of sharrows to connect the facility through the pinch point. Not all sharrows are worthless, but most sharrows are worthless.)
In FY20-21, LADOT installed two new sharrowed bike routes - on Montana Avenue (in Brentwood) and Oxford Avenue (in Koreatown.)
And what's worse than LADOT's sharrows? That would the L.A. City Public Works Department's Bureau of Engineering's sharrows. In FY20-21, BOE added two new sharrow facilities - both in places where bike lanes had been approved - both on projects whose ostensible purpose was to connect cyclists to major parks.
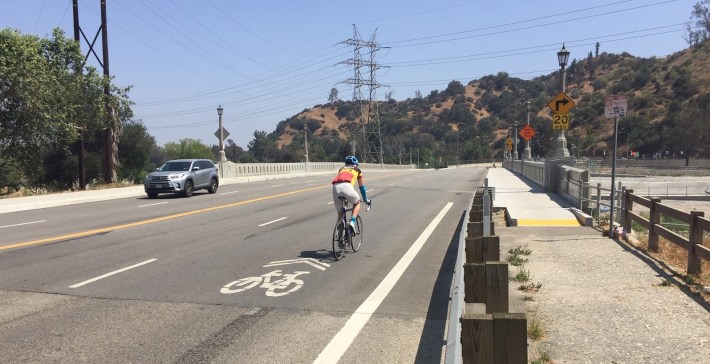
BOE installed sharrows on the renovated Riverside Drive Bridge - in lieu of bike lanes approved for the bridge. The bridge is located in Griffith Park, and is used by many cyclists to enter the park.
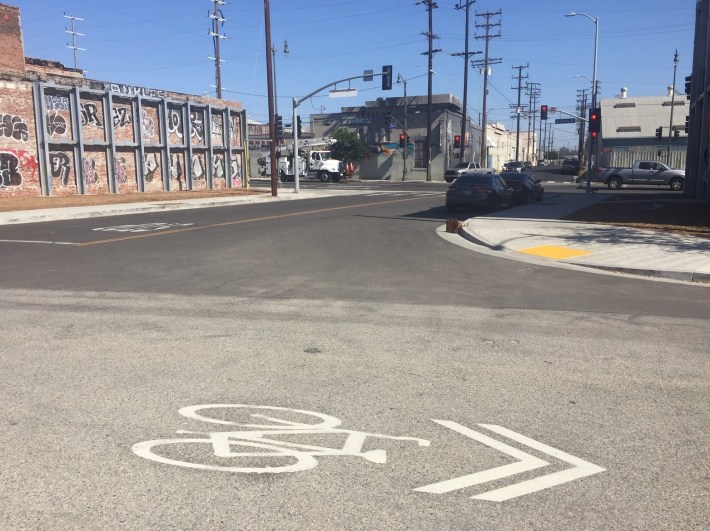
The BOE's North Spring Street Bridge renovation project tore out a hundred-year old building in order to give cyclists better access to L.A. State Historic Park. Approved bike lanes on the basically-completed bridge have languished since 2018... and are now anticipated to be completed by mid-October 2021. The BOE did manage to plop down a couple of ridiculous sharrows pointing just one way on Baker Street. The sharrows are parallel to (about 50 feet away from) the frontage bike path at the park - where cyclists actually ride.
See also SBLA coverage of earlier annual LADOT bikeway implementation: FY19-20 , FY18-19, and FY15-16. SBLA is planning, similar to last year, a follow-on piece highlighting some missed opportunities in FY20-21. Thanks to Michael MacDonald for graphing these each year.
