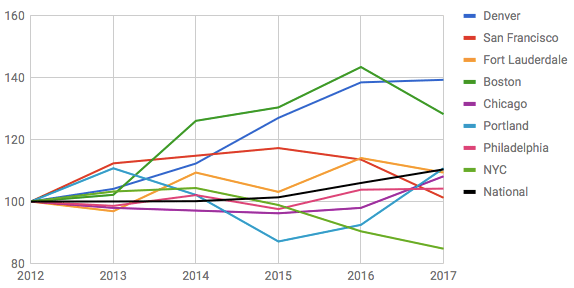
Back in December we posted a chart of annual changes in traffic fatalities in six American cities that have adopted "Vision Zero" goals. There was no real discernible pattern, suggesting cities have yet to make much progress in reducing traffic deaths.
With data for 2017 now available, we updated the chart and added a few more cities. In several places, traffic fatalities fell much more sharply last year than in the nation as a whole. Does that mean Vision Zero policies are working? Well, it's still too soon to tell.
Traffic deaths, especially in smaller cities like Portland, are subject to sizable year-to-year variation. A change in any given year doesn't say much -- only sustained reductions over a period of several years would indicate that Vision Zero policies are making an impact.
In Boston, traffic deaths fell in 2017 despite what advocates characterize as a lackluster commitment to traffic safety policies from Mayor Marty Walsh.
Stacy Thompson, executive director of Boston's Livable Streets Alliance, said the decline in Boston was good news, but she hesitates to draw conclusions.
"It’s much like any public health trend," she said. "This is a promising shift, but we need three to five more years of downward trends and analysis to fully understand if this is working."
New York and San Francisco are the only two cities we tracked that have maintained a multi-year downward trend.
Like Thompson, San Francisco Bicycle Coalition Executive Director Brian Weidenmeier hesitates to draw conclusions.
"It’s an encouraging sign that 10 fewer people died on our roads," he said, "But we need to make sure it’s a sustained effort."
Most of the 2017 reduction in fatalities in San Francisco was among car occupants. There was one fewer bike fatality and the pedestrian death rate was largely unchanged, Weidenmeier said.
"Now is not the time to be less vigilant when it comes to investing in the kind of infrastructure improvements San Francisco needs to see," he said.
One thing an exercise like this makes clear is the need for better traffic safety data. Fatalities are obviously the worst possible outcome and it makes sense to track them, but as a gauge of year-to-year traffic safety trends, the sample size is too small to reveal much, especially in smaller cities.
A better metric is to combine fatalities and severe injuries, which is less subject to random fluctuations.
Some cities do track progress this way, including Seattle. On the city's open data website, you can look up the changes in fatalities and severe injuries indexed to population.
Unfortunately there's often a significant lag before data on injury severity is finalized. And many cities don't make it easy to get the information that is available. To get a better understanding of whether cities are making progress on their Vision Zero goals, the public will need better access to that data.


