Vision Non-Zero: the Human and Financial Toll of Los Angeles’ Dangerous Roads
In Los Angeles, traffic is the talk of the town. At the office, in the bar, at the salon, traffic is bigger than the Beatles, bigger than the weather. It’s the first thing visitors ask about, and often it’s the first thing we Angelenos talk about — a bit reverently, a bit cathartically — when we visit someplace else.
Traffic is something that we beat, with back routes that we guard like they were mountain fishing holes — at least until Waze came along. But traffic is also something that beats us: every commute, and every year, is worse than the last. It’s easy to lose sight in the gridlock that the traffic problem in L.A. rises well beyond an annoyance. Traffic in Los Angeles is also notoriously deadly — and it’s getting deadlier.
Blue City, Red Transit
According to the U.S. Department of Transportation, Los Angeles sees about five traffic fatalities per week, all year long. That’s ~8 fatalities per 100,000 residents, per year. How does this traffic fatality rate stack up against other cities? While Los Angeles is by many measures a progressive city, in terms of traffic impacts, L.A. more closely resembles cities like El Paso and Las Vegas than it does other ‘progressive’ cities like New York and San Francisco.
Pedestrian fatality rates are even more grim. Los Angeles has about twice the rate of pedestrian fatalities as San Francisco, Chicago, and New York, and about four times the rate of Seattle. To put this into perspective: over the last several years, the majority of people killed by cars in Los Angeles were not even in one.
If these overall traffic fatality rates are alarming, the specifics about who is being affected are downright haunting. In particular, older and younger residents are at higher risk. In fact, motor vehicle collisions are the leading cause of death for children in Los Angeles County aged 5–14.
Vision Non-Zero in Los Angeles
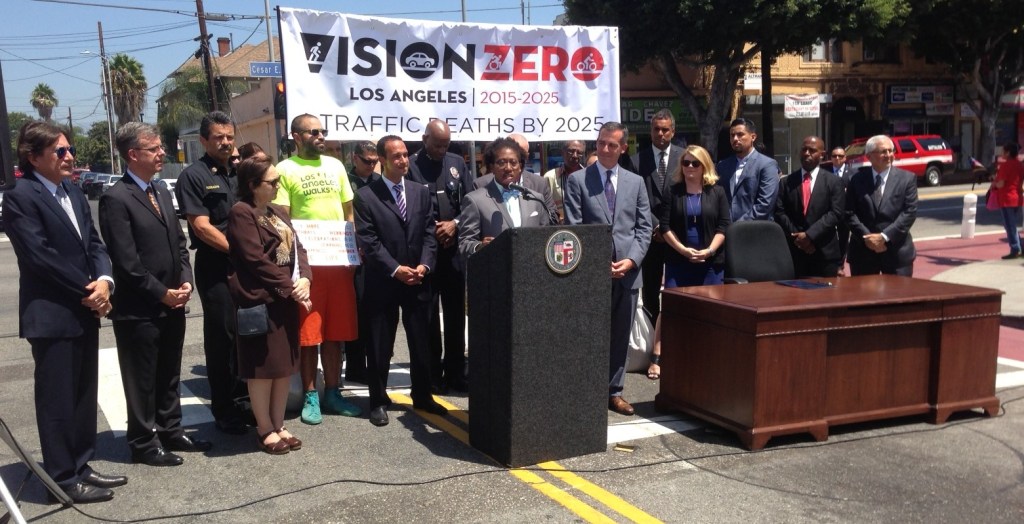
Responding to this rash of violence, many cities — L.A. included — have signed on to a project known as ‘Vision Zero’, which aims to fully eliminate traffic fatalities. Vision Zero uses a variety of data-centric means to meet this goal, including improved road design, increased enforcement, and decreased speed limits where pedestrians and vehicles are likely to meet.
The good news is that if Vision Zero policies are implemented, they really seem to work. Take, for example, New York: since the city signed on to Vision Zero in early 2014, traffic fatalities have seen a marked reduction. An unfortunate counterexample is L.A. — where Mayor Garcetti and the city Transportation Department (LADOT) released a Vision Zero strategic plan in late 2014, but dragged their feet on actually implementing that plan. L.A. has seen a strong increase in traffic fatalities; as a result, Los Angeles now sees about 30% more annual traffic fatalities than New York — despite being only half the population of New York.
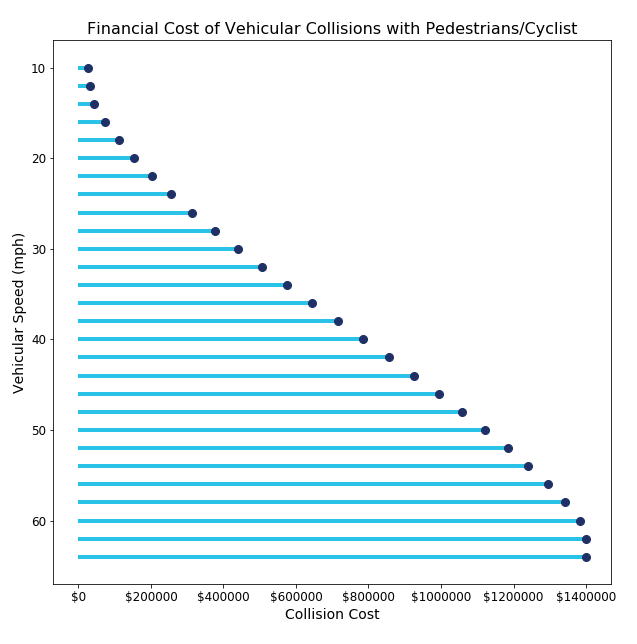
Beyond the obvious and catastrophic human toll of the roads in Los Angeles, there is also a disturbing financial toll. According to the USDOT, as of 2010, the cost of a fatal collision was about 1.4 million dollars. Roughly half of this cost is footed directly by cities, states, and individuals — as medical and funeral bills, lost labor productivity, and emergency response costs, for example. The other half is footed indirectly, through insurance costs. In both cases, road users — including tax-paying pedestrians and cyclists— are eventually covering the bill. In Los Angeles in 2018, that bill came to nearly $400 million.
How Did We Get Here?
There are many factors contributing to the increasing danger on the streets. One factor is age. Older people are more likely to die in any given collision, and as the median age of Americans has edged upwards, so has the probability of fatal collisions.
Another factor is vehicle design. SUVs and light trucks have flatter, sharper, and higher front surfaces than sedans, and because of this they are much more likely to kill people — particularly those outside of cars — than sedans are. A staggering 50% of new vehicle sales are SUVs and trucks, and this means that even if the number of collisions in Los Angeles doesn’t change, the number of fatalities from those collisions will. While American cars have increasingly been able to reduce the fatality rate for their occupants, they have exported the death toll to the strangers they encounter on the streets.
A third factor is speed. While a pedestrian hit by a car traveling at 30mph only has about a 20% chance of dying, a car traveling at 40mph will kill about 50% of pedestrians. By the time a car is moving at 50mph — a rate of speed common on many neighborhood streets in Los Angeles — it will kill almost any person it encounters. In other words, slight increases in vehicle speed translate to huge increases in fatalities.
Some Vision Zero cities have recently decreased speed limits and re-engineered roads to address this issue, but in many cases Los Angeles is moving in the opposite direction: the city recently increased the speed limit on about 100 miles of streets.
Why? The city has argued that, due to outdated state speeding law, increasing speed limits will make it easier to write tickets. In other words, the city can only increase enforcement if it makes the streets more dangerous. But given the human and financial toll of even a single traffic fatality, and given that increasing speed amplifies fatality risk, it is hard to imagine that this policy was carefully considered. And while State Assemblymember Laura Friedman recently passed a bill to address this speed issue — a bill signed into law by the governor — groups such as the CHP, the AAA Auto Club, and the Teamsters have effectively sidelined that bill.
An analysis of how collision cost increases with vehicle speed begs the question: how many tickets are a severe injury worth? How about a fatality?
How Do We Fix This?
Lucky for us, there’s already a plan: Vision Zero. Unfortunately, our City Councilmembers and mayor have allowed that plan to languish — as though protecting the lives of their constituents were an act of reckless bravery, rather than the barest minimum of their job’s requirements. Should they get their act together, Vision Zero does provide an (inaptly named) roadmap:
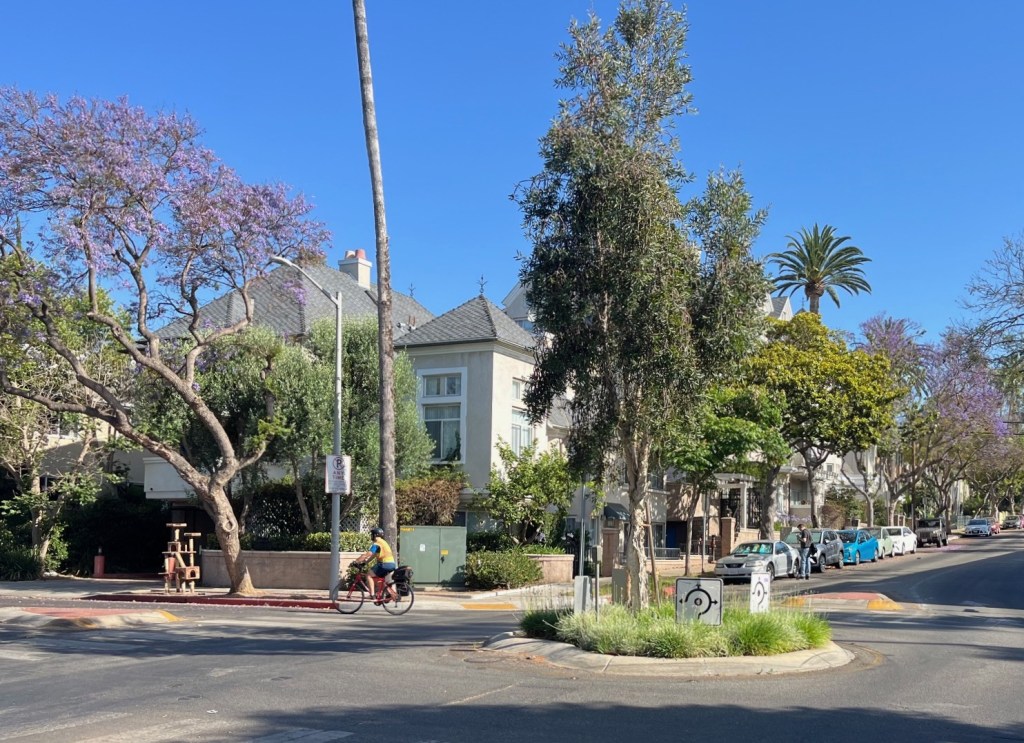
Speed, as a major factor in collision fatality rate, is a great place to start. Much can be achieved simply through changing the way we build our roads — and updating existing roads. Los Angeles builds many of its surface streets as though they were freeways: many wide lanes, gentle curves, and long stretches between stoplights. This type of road design encourages driving at freeway speeds in neighborhoods, and that means that collisions are likely to be catastrophic. Moreover, Los Angeles spaces its pedestrian crossings and road entrances at intervals that either grossly penalize walking or force walkers and drivers to cross traffic moving at freeway speed. Increasing protected pedestrian crossings and road entrances, or ‘access density’, has the effect both of reducing vehicle speed and of reducing unprotected crossings.
Speed can also be reduced with road narrowing, and ‘road diet’ programs, including added bus lanes, bike lanes, and safe pedestrian crossings. Contrary to the expectations of many people, research shows that road diets help to increase property value and business utilization, all while making roads safer.
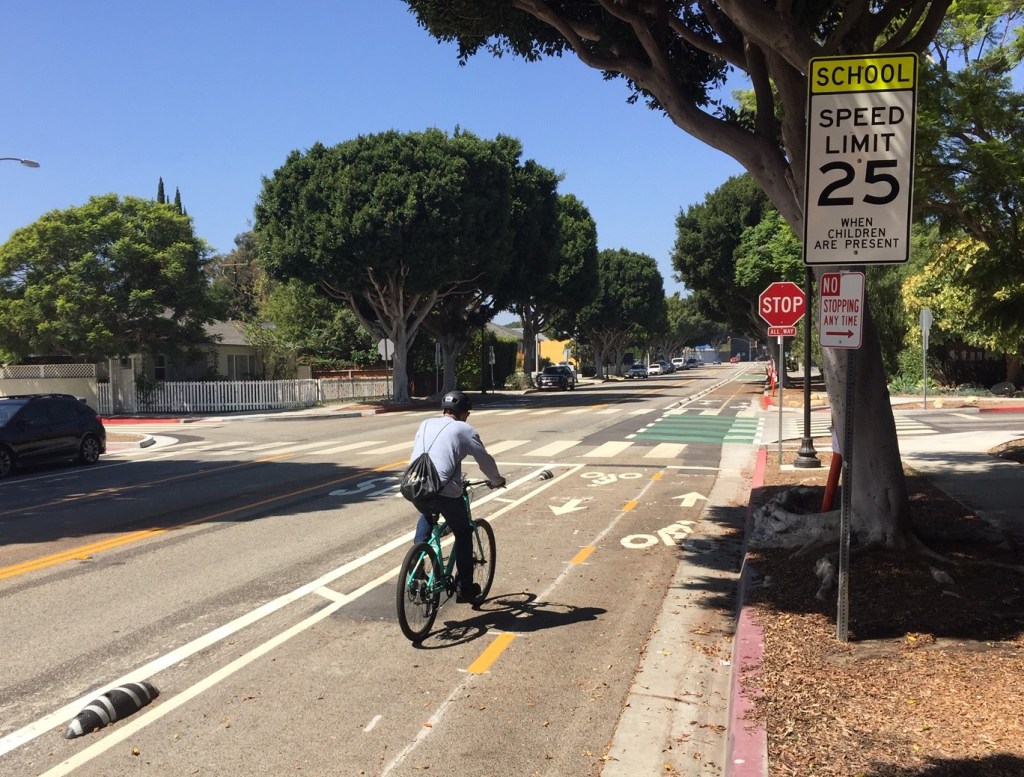
Nonetheless, even basic road diets, such as the Rowena road diet — which is outside of an elementary school and was put in place after an avoidable pedestrian fatality — have faced strong opposition. Some of this opposition is from area residents who fear that their own streets have become cut-throughs. The solution to this problem should be slowing speeds on those roads as well, not simply exporting the problem. And often opposition is not from area residents at all, but from small groups of commuters who do not want to slow down.
In other words, drivers who are passing through are arguing that their right to drive fast outweighs the safety of the people who live nearby. An eleven-year-old resident quoted in the above article rejects this argument in a suitably blunt manner: “I don’t understand why driving a car makes you think you’re more important than someone else. You’re not.”
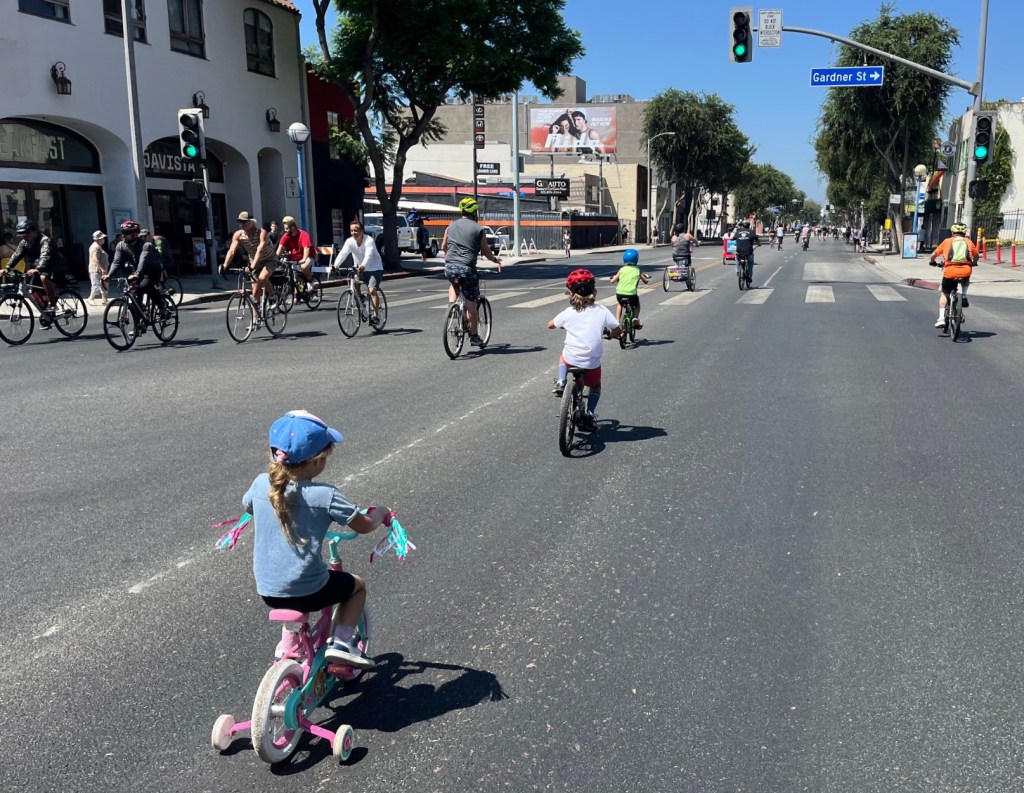
When used correctly, road diets can also greatly increase the number of people that can get through a particular route in a certain amount of time. While an unblocked bus route might be unsightly for drivers in gridlock, a whole city block’s worth of personal vehicles can fit their occupants into one bus. In fact, as an ambitious project in New York has recently shown, excluding cars altogether from a major city route has resulted both in an increase in bus ridership and a decrease in transit time for those riders. San Francisco has followed suit, with a supermajority of local politicians deciding to close Market Street to personal vehicles. This is what transit leadership looks like.
Los Angeles also knows where to start, in the geographical sense. A shocking 70% of the city’s traffic fatalities occur on just 6% of its streets. Updating these ‘priority corridors’ to make them more safe will have a major impact on the city’s traffic fatalities. Unfortunately, the city has dragged its feet in addressing these corridors, and they continue to be deadly.
Is Los Angeles the City We Want It to Be?
The standard position in L.A. over the last several decades has been that all transit priorities should work to increase speed and convenience for drivers. This has meant that while other progressive cities have worked to limit their carbon footprints, Los Angeles has displayed a stunning level of inaction on climate change — a problem that will not be solved by electric cars.
It has meant that the city has failed to expand public transit, even if that transit improves social equity and even if it sustainably moves more people than cars can. It has meant that a city with 200 square miles of parking spaces can never seem to find enough room for new green spaces or housing.
And it has meant that there is no safe haven on our streets, not even for children walking to school. The city may see more traffic fatalities this year than it will see homicides. Traffic is killing us in more ways than one.
Given these costs, does prioritizing speed over safety really reflect the values and politics of Angelenos? Having a serious discussion about changing our transit priorities is in order. And as long as we’re discussing that, one other thing will remain unchanged: traffic will still be the talk of the town. At the cafe, the bar, and the office. Let’s hope that at City Hall it’s more than just small talk. Our lives may depend on it.
Ryan P. Dalton is a Los-Angeles-based neuroscientist, writer, and advocate. He is a frequent contributor to Scientific American’s Mind Matters. Find him at ryandalton.weebly.com or at @bike_los on Twitter.

Streetsblog has migrated to a new comment system. New commenters can register directly in the comments section of any article. Returning commenters: your previous comments and display name have been preserved, but you'll need to reclaim your account by clicking "Forgot your password?" on the sign-in form, entering your email, and following the verification link to set a new password — this is required because passwords could not be carried over during the migration. For questions, contact tips@streetsblog.org.