California GHG Inventory Shows Slight Downward Trend. Mostly.
Note: GJEL Accident Attorneys regularly sponsors coverage on Streetsblog San Francisco and Streetsblog California. Unless noted in the story, GJEL Accident Attorneys is not consulted for the content or editorial direction of the sponsored content.
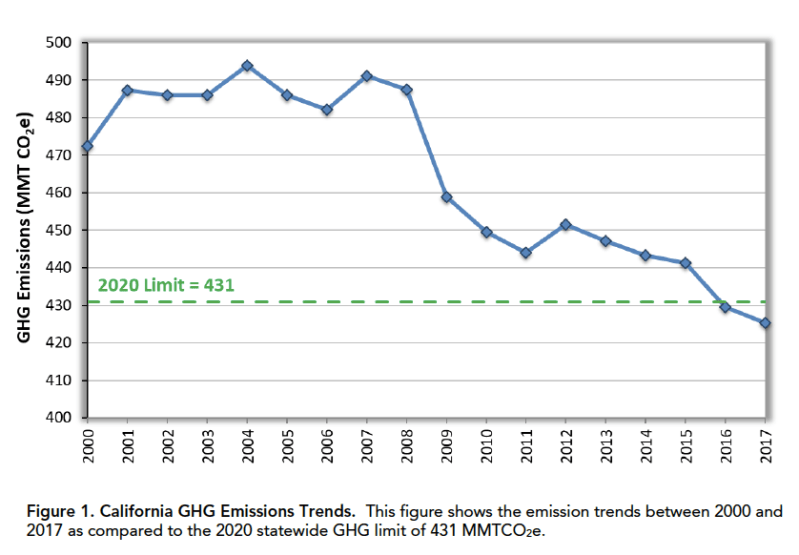
The California Air Resources Board released its latest greenhouse gas inventory, which uses data as late as 2017. It takes a long time to collect and analyze GHG data, so the process of tracking emissions tends to be a backwards-looking process.
The report shows that California seems to be reaching its greenhouse gas emission reduction goals for 2020 a little early, which is great. “This is further evidence that California’s groundbreaking climate regulations are helping to deliver the greenhouse gas reductions needed to meet our 2020 target – and give us a running start at our even more ambitious 2030 target, too,” according to California Air Resources Board Chair Mary D. Nichols.

The latest trends show a decent downward trend in the electricity sector, which has been under the cap-and-trade program longer than other industries. The overall state power grid is reducing its reliance on natural gas, which is the main source of greenhouse gases for electricity generation. Over time, the state’s electric grid has been using more zero-greenhouse-gas sources, and in 2017, those sources surpassed fossil fuel sources for the first time since California started tracking its greenhouse gas emissions in 2000.

But emissions in other sectors are still rising, particularly from on-road vehicle use and oil and gas refineries. CARB says there are signs that these may be leveling off, because they “did not rise as fast as in previous years.” But they still rose.
Per capita GHG emissions have dropped a lot since their peak in 2001, and overall emissions have dropped at a slower rate since they reached peak levels in 2004.

The inventory report also finds some good news around the carbon intensity of California’s economy–the amount of carbon pollution per million dollars of gross domestic product, which is declining even as the economy is growing.
Note this report inventories greenhouse gas emissions, not all emissions, although other pollutants tend to rise and fall in similar ways.
More details can be found in the report.


Read More:
Streetsblog has migrated to a new comment system. New commenters can register directly in the comments section of any article. Returning commenters: your previous comments and display name have been preserved, but you'll need to reclaim your account by clicking "Forgot your password?" on the sign-in form, entering your email, and following the verification link to set a new password — this is required because passwords could not be carried over during the migration. For questions, contact tips@streetsblog.org.