Some intersections are riskier to cross than others, but looking at the number of pedestrian injuries alone doesn’t tell the whole story. A new study from Minneapolis combines crash data with pedestrian counts to deliver a more nuanced picture of traffic dangers for people on foot. Among the findings: There’s safety in numbers for pedestrians.
Using data from the city government, University of Minnesota researcher Brendan Murphy and his co-authors looked at 448 intersections where both pedestrian counts and automobile counts were available, then cross-referenced that data with the city’s crash reports. They found a strong negative correlation between the number of pedestrians and the risk of being hit by a car.
While the study found people are less likely to be struck by a driver at locations where lots of people walk, it does not establish causation, Murphy says. “We don’t have good statistical evidence to show that if a place is safe, people will walk -- or in the other direction, that if people are walking, they make the place safer,” he says. “I personally think it’s a bit of both.”
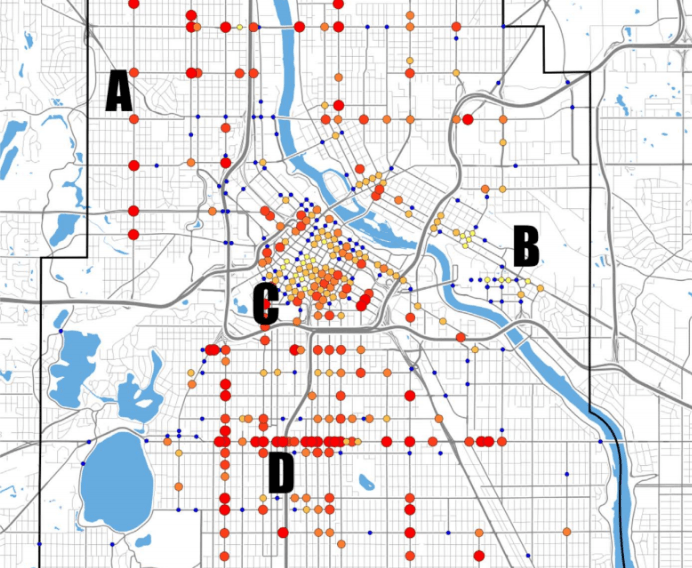
Per person, pedestrian-rich areas downtown and near the University of Minnesota pose a low risk for people walking, though they have a high absolute number of pedestrian crashes. Quieter intersections in more residential neighborhoods also pose a lower risk.
A few streets jump off the map as high-risk areas, like Lake Street, which runs east-west across South Minneapolis, and Penn Avenue in North Minneapolis. Both are used by a steady if not enormous number of pedestrians, but are meant first and foremost to move lots of cars. “We can ask, ‘How are those roads designed?’” Murphy says. “They are two lanes each way, no shoulder or bike lane.”
The study looked at all crashes involving pedestrians, not just injuries and fatalities, in order to include enough data points to reach reliable conclusions. It also looked at the stats from 2000 to 2013 in aggregate, rather than year-by-year, so it doesn’t take into account intersection redesigns or major changes like the opening of a light rail line. If there were enough data, Murphy says, “it would be really nice to do a year-by-year analysis.”
The study did not consider the relationship between pedestrian risk and income or race, but the authors say that needs attention. “Equity is a very big problem in terms of pedestrian safety and poor and minority people are getting killed by cars at much higher rates,” Murphy said.
The authors hope their research will lead to better measurements of pedestrian safety and methods to improve it. In 2016, the U.S. Department of Transportation’s four-year strategic plan set a goal of reducing fatalities for pedestrians and cyclists to 0.15 per 100 million vehicle miles traveled by 2016. But that's the wrong way to look at the problem.
“If we frame pedestrian deaths in terms of VMT, we’re really framing it in terms of automobiles themselves and car traffic,” said Murphy. “We should be focused on reducing pedestrian deaths as a percentage of the pedestrian population.”
There’s also a need for better data collection. Cities and states regularly collect standardized data on car and truck traffic, but there’s no standard for non-motorized users. This data is often collected manually and its reliability varies from city to city. In Minneapolis, three counts throughout the day at each intersection were added together to create a six-hour total. Other cities have different methods.
“Ideally we would like to have our cities wired up and know how many pedestrians are crossing each intersection,” Murphy says. “We need to focus in on the pedestrian population and really ask ourselves, where are they really experiencing undue burdens of risk and what can we do about it?”


