LACBC 2015 Bike Count Results: Observed Bicycling Down Slightly
Yesterday, the L.A. County Bicycle Coalition released its 2015 counts of people walking and bicycling. The LACBC has an excellent summary page with highlights and charts where the report is available to download.
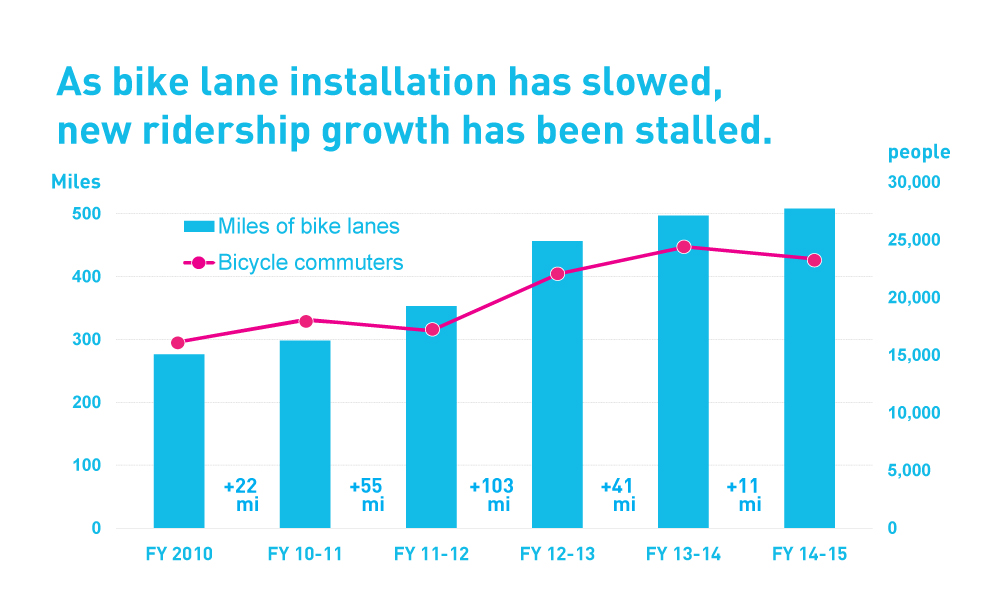
One unwelcome trend that LACBC found (roughly corresponding to the red on above graph) was that bike ridership declined nine percent from 2014 to 2015. These counts are a snapshot, with some variability, so data is not conclusive. The overall 2010 to 2015 trend is upward.
It is difficult to determine what causes a down-tick in a single year’s data. The bicycle coalition suggests it is, in part, attributable to LADOT’s slackening in implementation of new bicycle facilities. After adding lots of new bike lanes from fiscal year 2011-2014, LADOT backed off on bikeway mileage in FY2015. This unfortunate trend worsened in 2016.
There are other possible factors. Again, none of these are conclusive. The apparent bike ridership decline occurred at a time of continued economic recovery and relatively low gas prices. At the national level, driving increased after about a decade when driving was flat (and declining on a per-capita basis.) At the same time, Metro transit ridership declined somewhat. It is possible that as more people go back to work, and upgrade their jobs and/or housing, their commutes get longer and they shift from bicycling to driving.
What do you think readers? Have you observed a decline in bicycling? What do you think might be causing it?
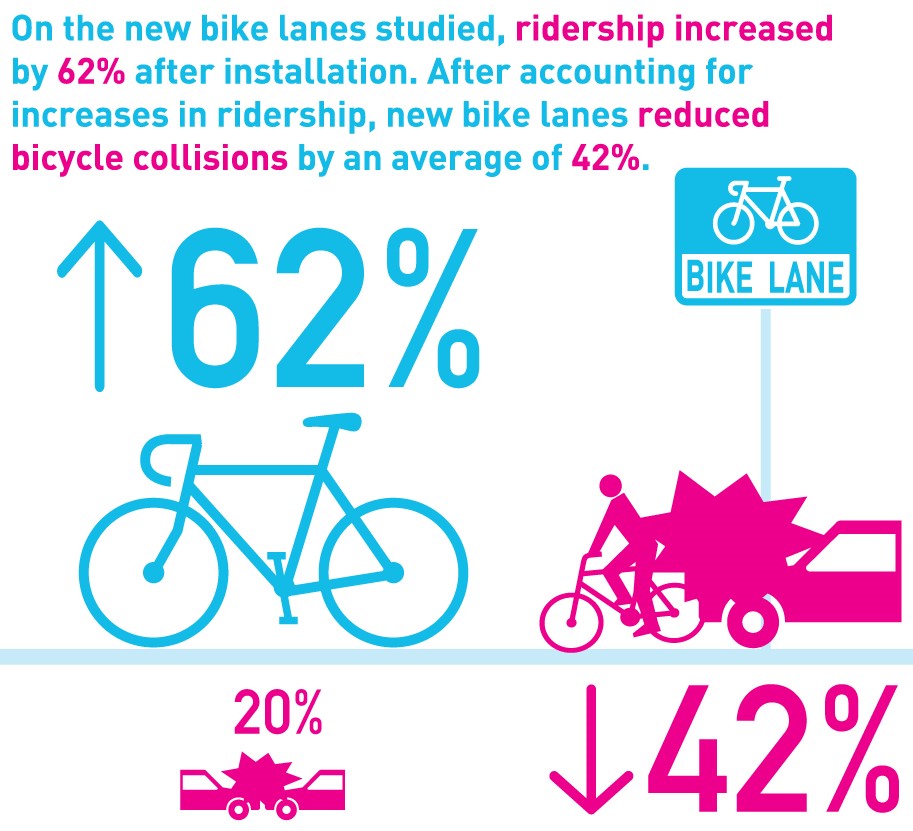
On a happier note, the LACBC observed that on streets where bike lanes were installed, ridership increased 62 percent, and bike lanes reduced collisions by 42 percent. On these streets, car collisions also decreased by 20 percent.
Read and download the full “L.A. Bike and Ped Count 2015: Who Gets Counted Counts” report here.

Streetsblog has migrated to a new comment system. New commenters can register directly in the comments section of any article. Returning commenters: your previous comments and display name have been preserved, but you'll need to reclaim your account by clicking "Forgot your password?" on the sign-in form, entering your email, and following the verification link to set a new password — this is required because passwords could not be carried over during the migration. For questions, contact tips@streetsblog.org.