Skip to Content
Streetsblog Los Angeles home
Log In
Streetsblog USA

A New Resource for Tracking Transit Trends in American Cities

This graph, which is interactive at the Transport Politic, shows how heavy rail systems are faring across U.S. cities.
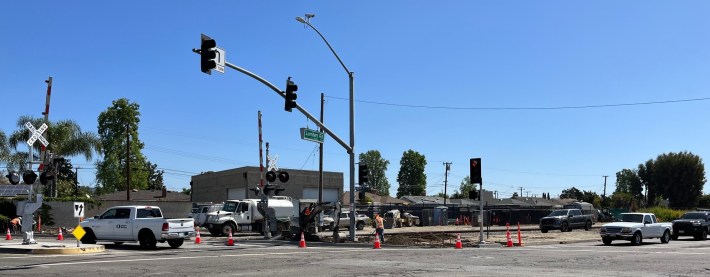
Whittier's under construction bike/walk path (left) runs along active railroad tracks (right) - 2022 photo by Joe Linton/Streetsblog

How does transit ridership in your city stack up against other cities? A new tool from transit analyst extraordinaire Yonah Freemark at the Transport Politic can help you figure it out.

Freemark's "databook" compiles a raft of data from the Census and the Federal Transit Administration into a series of graphs and tables that show trends in transit ridership in selected U.S. cities. Here you can see how bus ridership is floundering in many American cities (but not Seattle):

bus_ridership
Chart: Transport Politic
Contractor xxxx

Be sure to check out the site itself, which has several more charts and tables.
Stay in touch

Sign up for our free newsletter

More from Streetsblog Los Angeles

Metro Updates: 25 Months of Ridership Growth, and More

Metro ridership is growing steadily, plus Metro 605/5/10/60/105 Freeway expansion, Metro Micro, bus electrification, C Line, and Metro wildfire response

January 18, 2025

SGV Connect 132: A Fond Farewell to Melanie Curry

This week’s SGV Connect Podcast features the entire Streetsblog in California team saying goodbye to the Streetsblog California editor, Melanie Curry, as she heads into retirement.

January 16, 2025
See all posts