This morning, Transportation for America (T4A) released a report, "Dangerous by Design" which gives a state-by-state ranking of how dangerous each state is for pedestrians. While there are certainly worse states to take a walk in than California, 6,957 Californians died (of 47,700 nationally) while walking as result of a crash between 2000 and 2009.
Locally, the news isn't any better. The Los Angeles-Long Beach-Santa Ana region ranked as the 27th most dangerous place in the country to take a walk; more dangerous than every California region except the Riverside-San Bernadino region and Greater Sacramento. 2,533 pedestrians were killed in the Los Angeles region between 2000-2009.
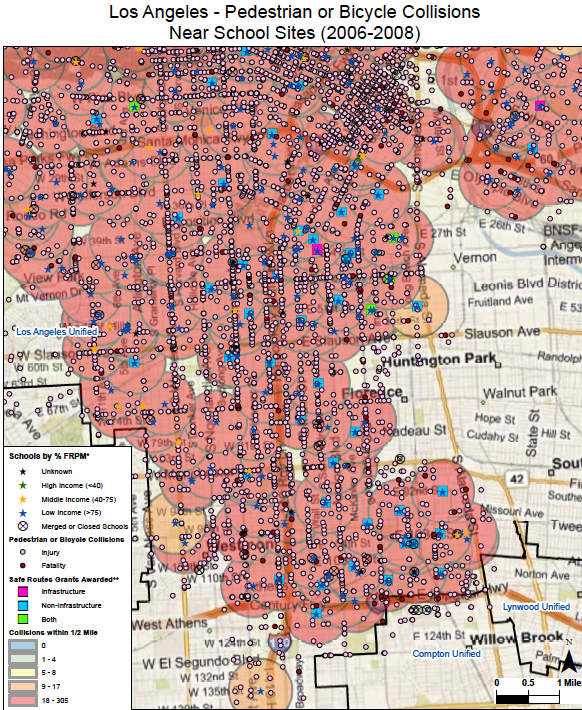
However, the reality of pedestrian danger really strikes home when looking at a new series of maps released by the State of California and University of California-Berkeley that break down how dangerous it is to walk to school based on the number of pedestrian collisions within one half mile of a school. That sea of red pictured in the map above is a jarring look at the main barrier to promoting walking and bicycling to school. In too many areas, parents believe it just isn't safe.
Predictably, where one lives and how much money one makes are the top factors in determining how safe it is to talk to school, or work, to do errands or just for exercise. T4A notes that low-income and minority communities are most likely to feel the brunt of poorly designed streets imperiling pedestrian lives.
In the 234 counties nationally where more than 1 in 5 families has a household income lower than the poverty level, the pedestrian fatality rate averages 2.91 per 100,000 persons, significantly higher than the national rate of 1.6 per 100,000 nationwide.
Meanwhile, the rates of pedestrian fatalities for non-Hispanic whites was 1.38 per 100,000. The rates were higher for nearly all minority groups, with 1.45 for Asian Americans, 2.23 for Hispanics and 2.39 for African Americans, per 100,000 people.
Nearly everyone agrees the solution to this safety epidemic is better funding for safer streets. But at the federal level, where a transportation funding bill seems to be mired in bureaucratic fear of asking voters to invest in our country's infrastructure, help seems a long way away.
“There is a debate in Congress now about whether the federal government should dedicate resources to protecting pedestrians,” said Ryan Wiggins, of Transportation for America. “The reality is that 67 percent of all pedestrian fatalities in the last 10 years occurred on roads eligible to receive federal funding. As taxpayers we should emphasize that our federal tax dollars be spent on improving safety, not putting our children, families, and friends at risk particularly when more people are choosing to walk and bike as a result of high gas prices."
Locally, the picture is equally bleak, although there are some silver linings.
A recently passed master plan for the Southern California Association of Governments region, which includes Los Angeles and five other counties, set aside a whopping half of a percent of its thirty year plan for bicycle and pedestrian projects despite the crash and fatality statistics for these modes making up a full 25 percent of all road fatalities.
However, there are some signs that underfunding pedestrian safety is going to change, although challenges remain.
"Turning around an auto-centric town like Los Angeles doesn't just require political will, it requires a major infrastructure investment to restore the pedestrian amenities we stripped away to make room for cars,” said Los Angeles City Councilmember and Transportation Committee Chair, Bill Rosendahl.
“The city (of Los Angeles) recently allocated $1.2 million in funding to develop a citywide strategy for Safe Routes to School to address the safety issue on the streets around our schools, however due to the current hiring freeze, this project could potentially stall if the City does not respond swiftly to provide the staff we need to work on this plan,” writes Alexis Lantz of the Los Angeles County Bicycle Coalition.
The $1.2 million comes from the Measure R Local Return funds. The City of Los Angeles dedicates 10% of their "local return" funds to bicycle and pedestrian projects.
But the battle for safe streets isn't just about staff, but about political will, Jessica Meaney from the Safe Routes to School National Partnership calls on Los Angeles to step up for safety. " We need the city to give us staff, a plan and projects on the ground right away so we can see our transportation priorities shift, putting safety first, people first, not cars.”


