Metro Average Weekday Ridership Exceeded One Million In September

For the first time in more than a year, Metro daily ridership surpassed one million boardings. For September 2026, Metro reported average weekday ridership was 1,022,776.
Ridership fluctuates somewhat depending on the time of the year; winter and summer generally see slightly lower ridership than spring and fall. Hence Metro ridership reporting generally focuses on comparing the same month in different years.
From late 2022 through mid-2025 Metro ridership grew every month, largely erasing ridership losses at the pandemic outset in 2020. Metro saw a return to a million-plus daily riders in September 2024. Weekday ridership exceeded a million again that October and in May 2025. Then, in June 2025, intensified ICE terror snapped a 30-month ridership growth streak.
ICE terror is still around, still harming Angelenos, and has been growing recently.
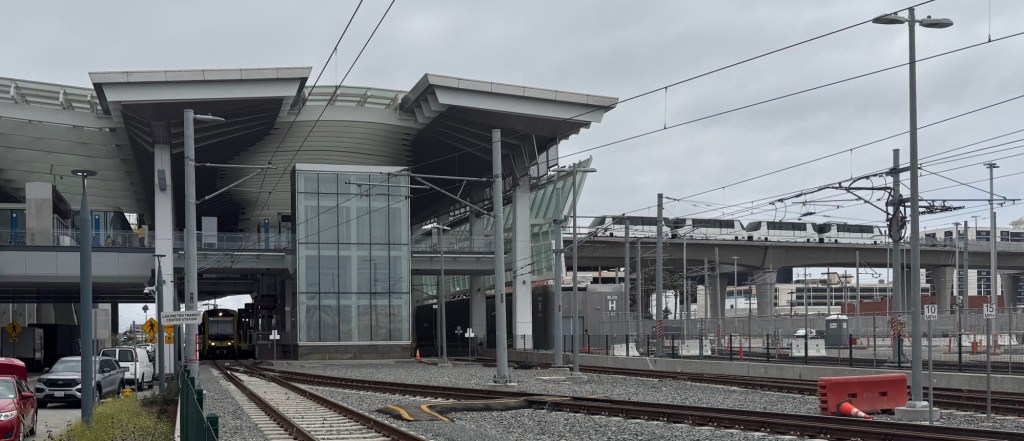
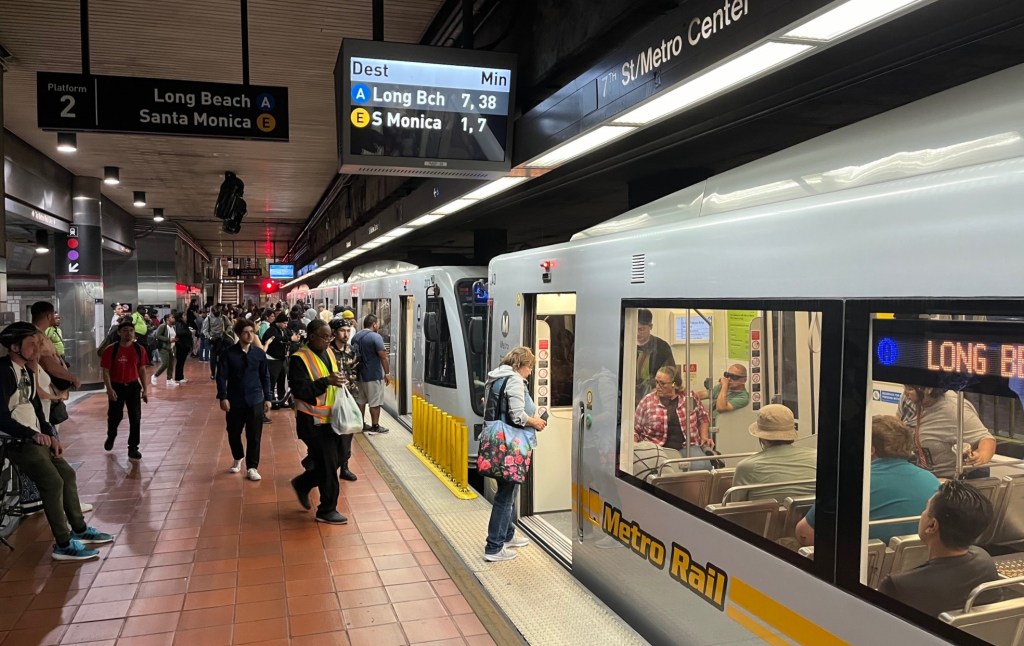
Many riders have returned to the Metro system, including bus and rail. And that rail system has grown. Last fiscal year, Metro opened new extensions of its D and A Lines.
With three new mid-city stations, last month the Metro D line saw nearly double the number of riders it had carried in September 2025. Metro reports overall D Line ridership is up a whopping 93%.
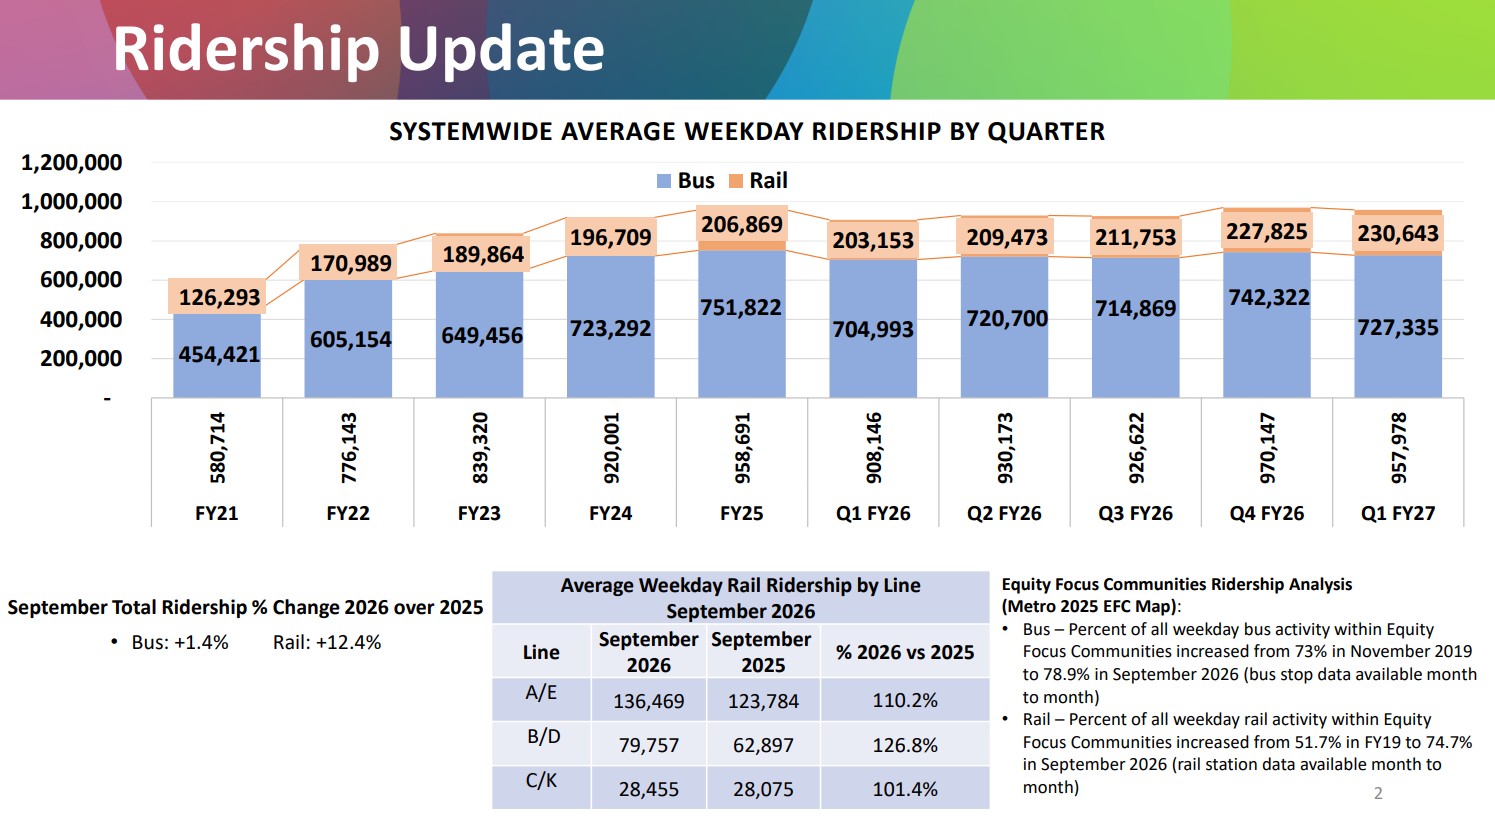
Comparing September 2026 to September 2025, overall Metro system ridership is up 4.4%. Rail ridership grew 12.4% while bus ridership grew 1.4%.
Last week Metro distributed a press release touting recent ridership growth, and outlining specifics. The full text of Metro’s release is below.
Metro’s D Line Ridership Nearly Doubles Year Over Year in September
Overall Ridership Grows to over 1 Million Weekday Boardings
LOS ANGELES (Oct. 16, 2026) – September marked the official start of fall, but Metro numbers continue to rise. Metro ridership was 27,281,003, an increase of 3.9% over September 2025. The D Line had the biggest year-over-year (YOY) increase, showing 114% growth on weekdays and nearly 93% overall.
Systemwide, ridership averaged 1,022,776 on weekdays, a 4.4% increase over September 2025. Saturdays averaged 720,083 boardings, and Sundays averaged 584,475. Nearly 20% of ridership came from customers enrolled in fare programs that offer free or discounted rides, including GoPass (for students in grades K-community college at participating schools), LIFE (for persons with qualifying incomes), U-Pass (for students at participating colleges and universities), and E-Pass (for employers who offer transit to their employees). The LIFE Program grew 35% YOY.
September was very busy with concerts, sports, cultural activities, and conventions. BTS played a multi-night run at SoFi Stadium, J. Cole performed at both Intuit Dome and Crypto.com Arena, and the Hollywood Bowl hosted a John Williams tribute. College football returned with home games for USC at Memorial Coliseum and UCLA at the Rose Bowl, plus home games at SoFi Stadium for both the Rams and Chargers. The Dodgers, Galaxy, LAFC, Sparks, and Kings all played at home. The highly anticipated Lucas Museum of Narrative Art in Expo Park opened in September, and the Los Angeles Korean Festival also took place at Seoul International Park. Long Beach Comic Con at the Long Beach Convention Center and the Los Angeles Low Rider Magazine Super Show at the LA Convention Center both attracted big crowds.
Rail Ridership Continues Growth Trajectory
Rail ridership remains strong, rising 12.4% over September 2025 to 6,698,337. Weekdays had the highest growth at 13.9%, with average boardings of 244,680. Saturday boardings averaged 194,793, a 10.5% increase YOY.
Other year-over-year rail ridership highlights include:
- A Line ridership increased 9.5% to 2,083,094, and grew 10.4% on weekdays to 244,680 average ridership.
- B Line ridership increased by 4.5% in September to 1,412,266. The biggest growth came on Sundays, up 24.4% to an average ridership of 49,300.
- D Line growth increased every day of the week. In addition to the phenomenal growth on weekdays, Saturdays had average boardings of 14,221 for a 24.5% increase and Sundays had average boardings of 11,457 for a 20% increase.
- E Line ridership was 1,658,854, a 10% increase, with Saturdays showing the strongest growth at 12.5% to 50,826 average ridership.
- K Line ridership grew 2.2% to 242,298, with Saturdays showing the biggest growth at 7.6% to 7,064 average ridership.
Bus Ridership Continues to Grow
Bus ridership rose 1.4% year over year, with a 2.2% increase on Saturdays to 525,290 average ridership. The J Line, a Bus Rapid Transit (BRT), was up 5.6%. Total bus ridership in September was 20,582,666.
Streetsblog has migrated to a new comment system. New commenters can register directly in the comments section of any article. Returning commenters: your previous comments and display name have been preserved, but you'll need to reclaim your account by clicking "Forgot your password?" on the sign-in form, entering your email, and following the verification link to set a new password — this is required because passwords could not be carried over during the migration. For questions, contact tips@streetsblog.org.