Interactive Map Shows Where Metro Thinks Multimodal Improvements Should Be Built
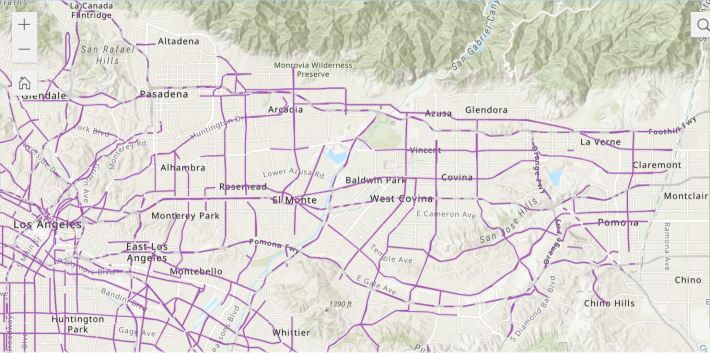
The map of Metro’s Draft Prioritized Active Transportation Network was revealed last week during community stakeholder briefings. In its default view, it shows where bikeways, pedestrian districts, and first-last-mile station improvements are prioritized by the agency. SBLA is calling this the Default Map here, and it’s the cover image above.
But the interactive map allows viewers to isolate the graphing for each of these infrastructure priorities. The darker the color of the graphing, the higher the weighted score that location received for planning priority. This is based on criteria discussed below.
Not only can viewers take in solo views of each type of would-be (maybe?) active transportation project, but we can also toggle on and off views of the data that led Metro to these priorities: Accessibility, Connectivity, Demand & Community Support, Equity, Safety & Comfort, and Sustainability.
Accessibility
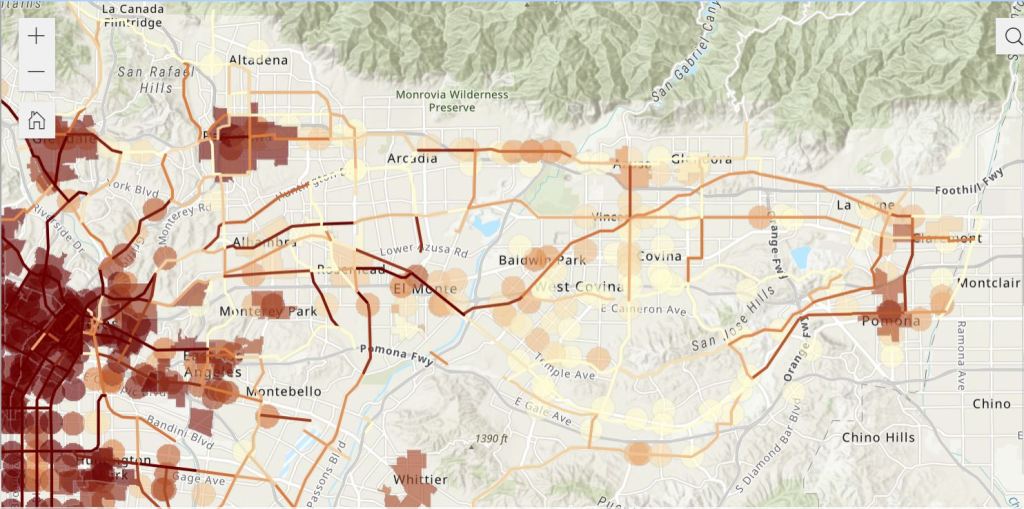
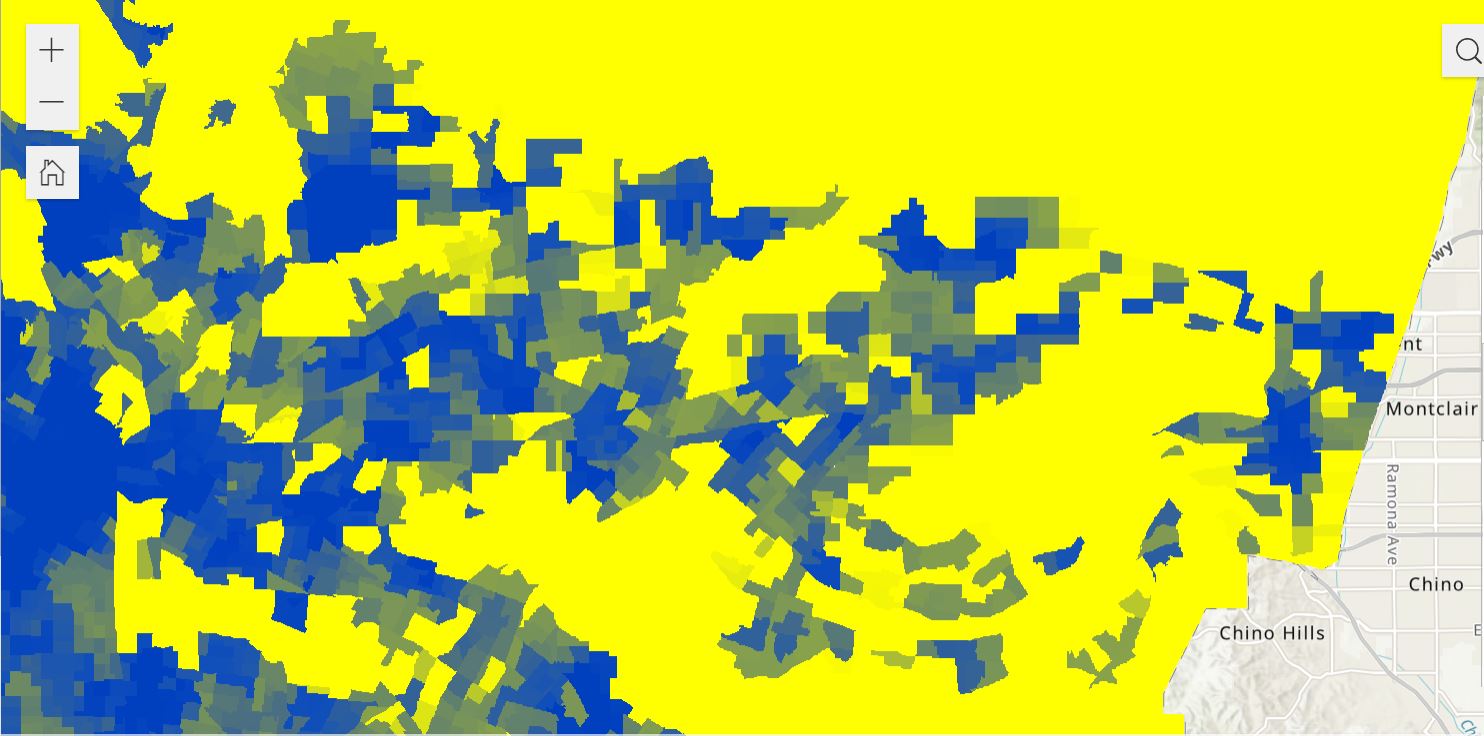
Let’s start with a look at one of the most visually overwhelming data fields: “Opportunity Score.” It refers to the density of walkable destinations within an area (shops, restaurants, schools, parks). Again, the darkest color (blue) represents the highest score.
While the cities in the SGV most prioritized for improvements (Pasadena, El Monte, Pomona) correspond on both the Default Map and the “Opportunity Score” map, it shows many other areas that are also shaded in dark blue, including Baldwin Park, Alhambra, Covina, and more.
Connectivity
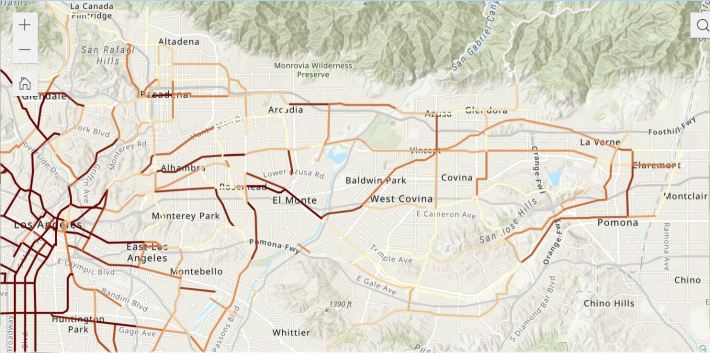
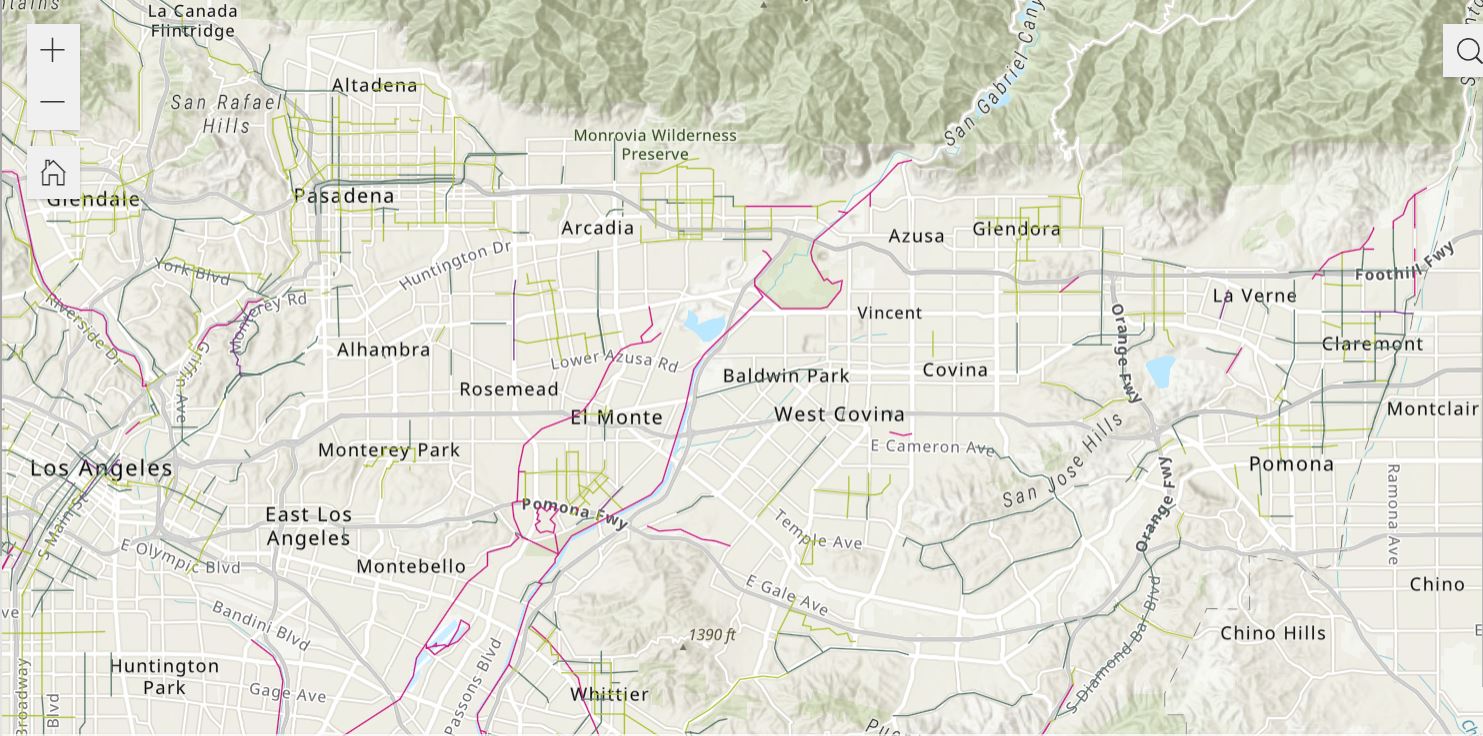
Next let’s view the region’s Existing Bike Network. The pink lines represent shared-use/off-street paths(Class I). Green signifies bike lanes (Class II). Yellow is Class III bicycle routes and bike friendly streets. Purple refers to Class IV, protected bike lanes.
Metro’s mapping of existing bike facilities is incomplete and has errors. In the SGV, it is missing some newer facilities including protected bike lanes on Workman Mill Road (opened April 2021) and on Valley Boulevard (opened March 2022). Metro misidentifies several bikeways in the city of L.A., including Northeast L.A.’s Monterey Road bike lanes (shown as protected from South Pasadena to Huntington Drive, but the actual projection only goes a few blocks in the Monterey Road Pass) and several bikeways in DTLA (existing 2nd Street, 5th Street, 6th Street, 11th Street, Figueroa Street, Grand Avenue, and Main Street bikeways are all mapped incorrectly).
Cross referencing with the Default Map, Metro places heavy priority for Bikeways along Valley Boulevard/Holt Avenue in El Monte and Pomona (where the SGV Transit Feasibility Study suggests building a BRT line). Looking at the Existing Bike Network and the Bike Collisions map (below) there’s a sore need in this corridor.
Demand & Community Support + Equity
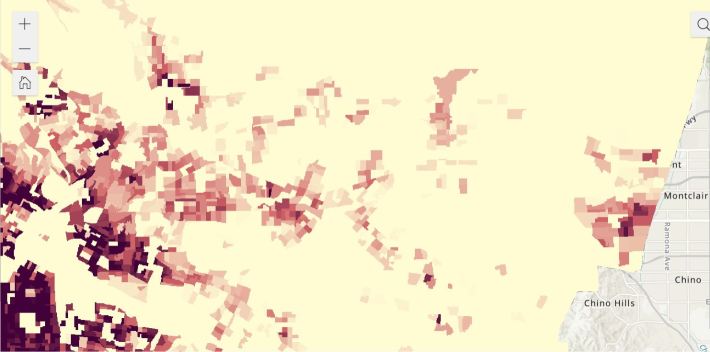
There’s some clear overlap between the following red graphed map that represents “Total Demand” for Active Transportation (darkest coloring means most demand), and the mapping of the Equity Focus Communities, shaded in brownish-yellow. In the Default Map, we see some of this addressed with a prioritized bike lane along Garvey Avenue in Rosemead and Monterey Park, and pedestrian districts in Alhambra, Rosemead, and Azusa.
Safety & Comfort
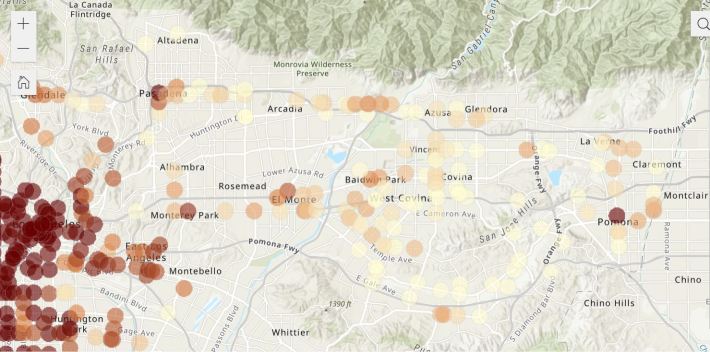
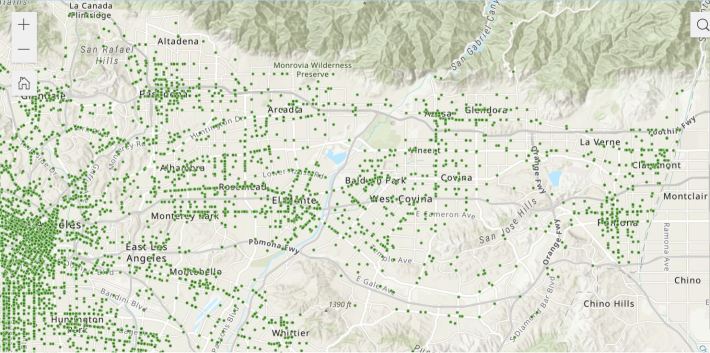
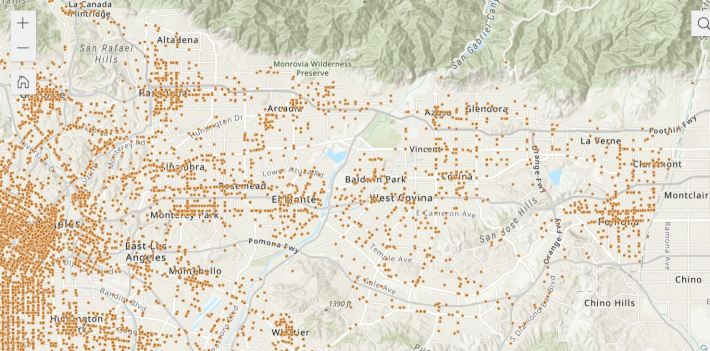
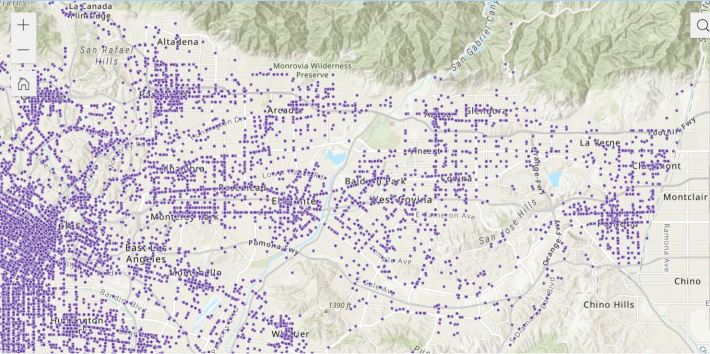
Now let’s see the following three maps charting Collisions for Bikes (green dots), Pedestrians (orange dots), and First-Last-Mile travelers (purple dots), as well as the very telling High Speed/High Volume map (purple lines). By far, the highest concentrations of collisions are in Pomona, Monterey Park, El Monte, and Pasadena, hence the darkest shaded projects on the Default Map.
Sustainability
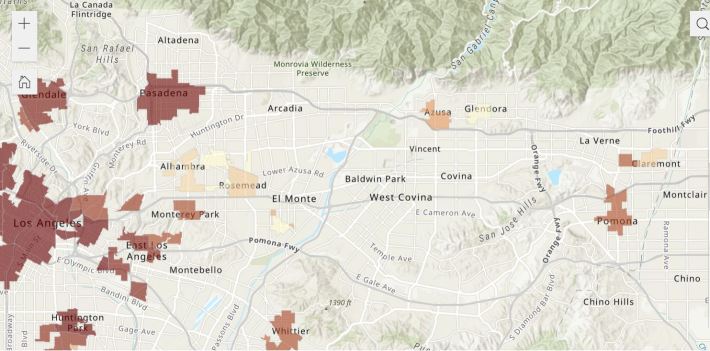
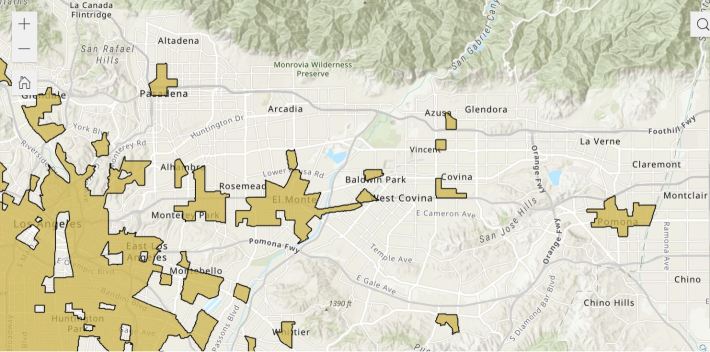
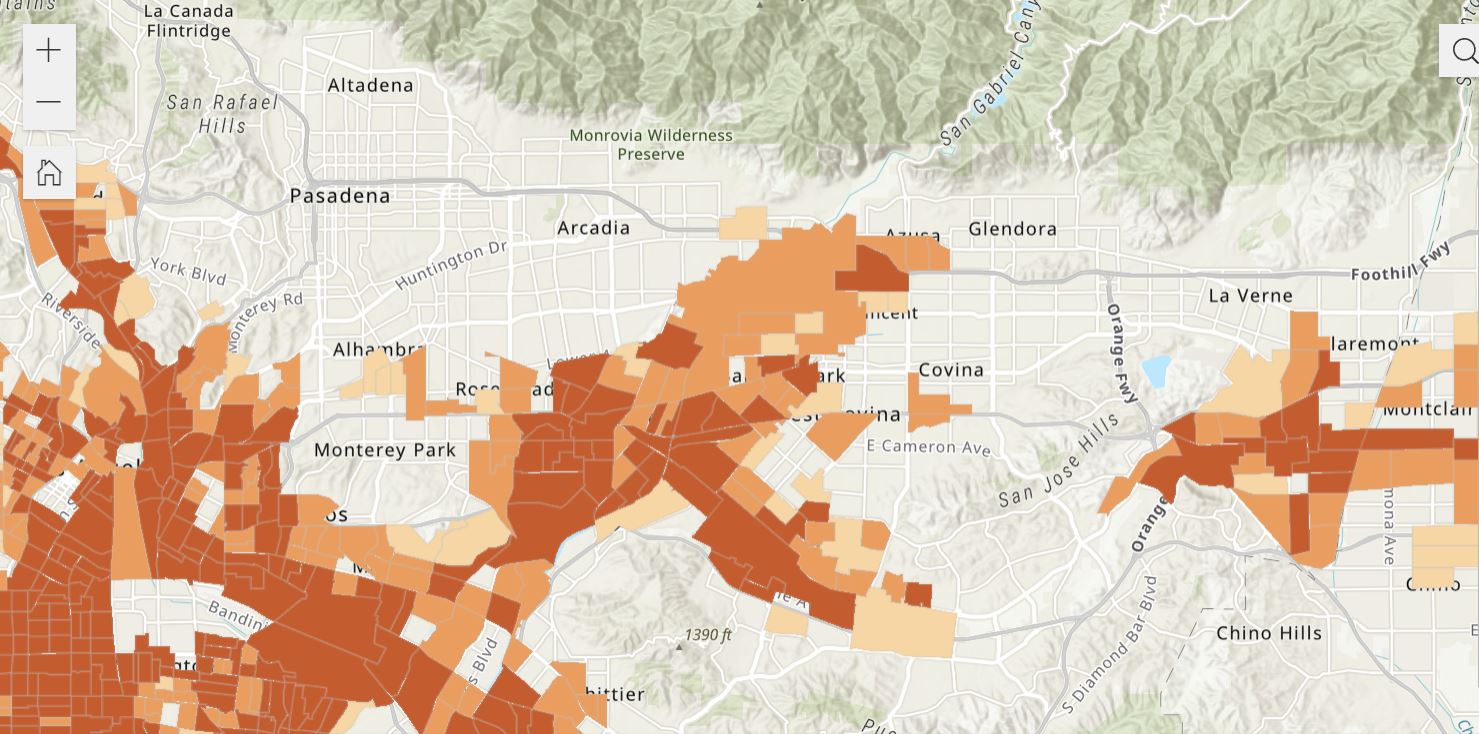
And Metro rounds out the data by marking up where CalEnviroScreen Scores exceed 75. Here, the San Gabriel Valley’s job hubs are all covered with burnt orange digital paint: Industry and the La Puente Valley, Baldwin Park, Irwindale, El Monte, Montebello, Pomona.
Of course, it’s all much more interesting once you start overlapping data sets to see if the imaginary infrastructure is going where it should. Here’s a map showing the prescribed Bikeways (tan-to-black lines), the Existing Bike Network (colorful lines), Bike Collisions (green dots), areas with High Demand for Bikes but Low Income (blue shading), and Equity Focus Communities (brownish-yellow shading).
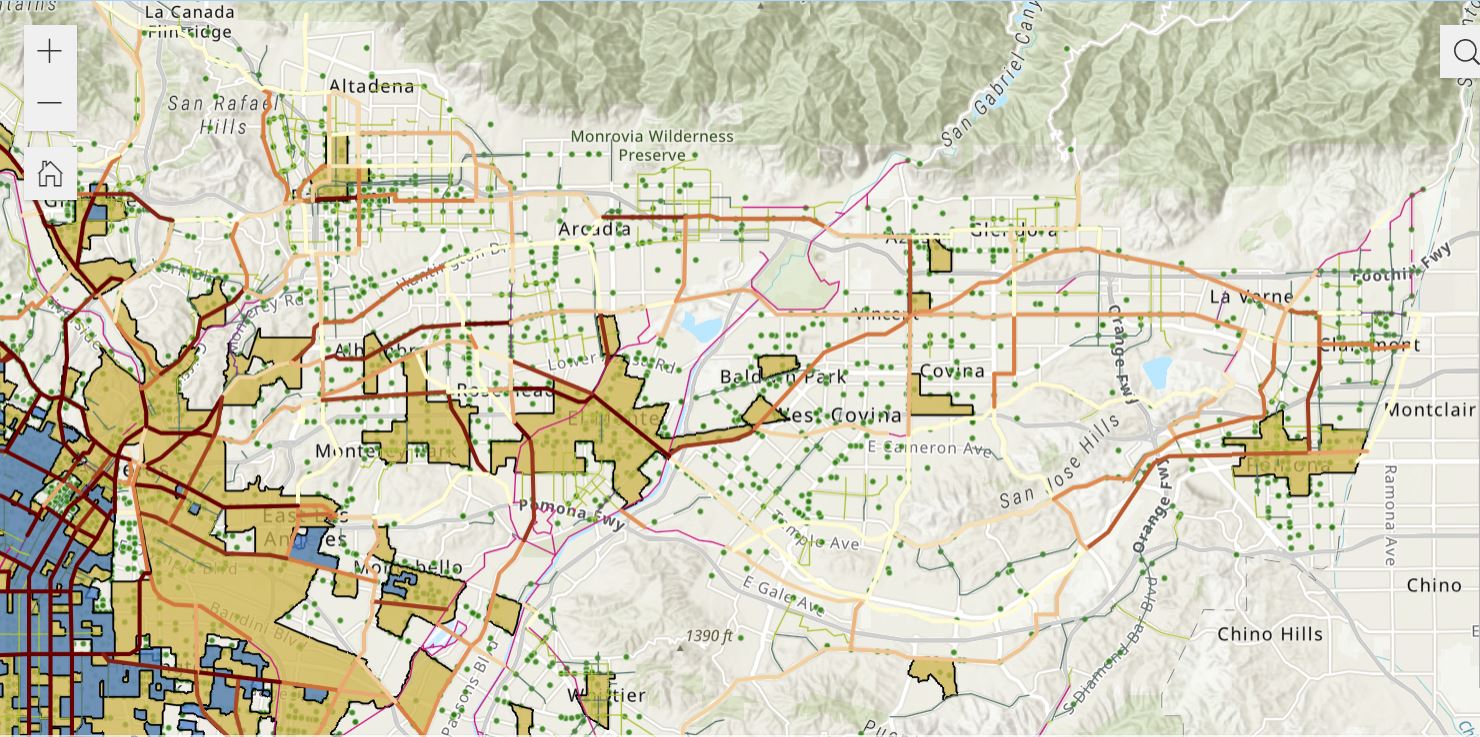
To create your own combinations of data, and look at the rationale behind Metro’s suggested projects, view the map here.
These maps inform Metro’s Active Transportation Strategic Plan. To some extent the plan will informs Metro investments in bike projects (including through Metro MAT grants and Measure M Subregional Program – see SGV MSP coverage from last October and December), but, for the most part, the plan doesn’t necessarily get implemented, because Metro does not own or control the right-of-way where bike/walk facilities would be located. These facilities are typically on streets, controlled by local municipalities: cities and the county. So even when Metro draws a line on a map, a local city will have to evaluate trade-offs (like finding space by removing parking or travel lanes), approved its own mobility plan, design the project, assemble funding, etc.
SBLA San Gabriel Valley coverage, including this article and SGV Connect, is supported by Foothill Transit, offering car-free travel throughout the San Gabriel Valley with connections to the new Gold Line Stations across the Foothills and Commuter Express lines traveling into the heart of downtown L.A. To plan your trip, visit Foothill Transit. “Foothill Transit. Going Good Places.”
Sign-up for our SGV Connect Newsletter, coming to your inbox on Fridays.
Streetsblog Editor Joe Linton contributed to this post.

Read More:
Streetsblog has migrated to a new comment system. New commenters can register directly in the comments section of any article. Returning commenters: your previous comments and display name have been preserved, but you'll need to reclaim your account by clicking "Forgot your password?" on the sign-in form, entering your email, and following the verification link to set a new password — this is required because passwords could not be carried over during the migration. For questions, contact tips@streetsblog.org.