L.A. City's fiscal year recently concluded, so it's time for Streetsblog L.A.'s annual look back at the past year's bikeway implementation. The picture is not bright.
Under Mayor Antonio Villaraigosa, bike facility implementation peaked at 200+ new bikeway lane-miles annually. Since Mayor Eric Garcetti took office in 2013, implementation has fallen dramatically. Under Garcetti-appointed city Transportation Department (LADOT) General Manager Seleta Reynolds, new bikeway mileage has been dismal, hovering between 10 and 52 miles annually for the past seven years.
It's not all Garcetti and Reynolds' fault, as their modest efforts have been blocked by many city councilmembers: Gil Cedillo, Paul Koretz, Curren Price, David Ryu, Mitch O’Farrell, and Paul Krekorian have all vetoed planned bikeway projects in their districts.
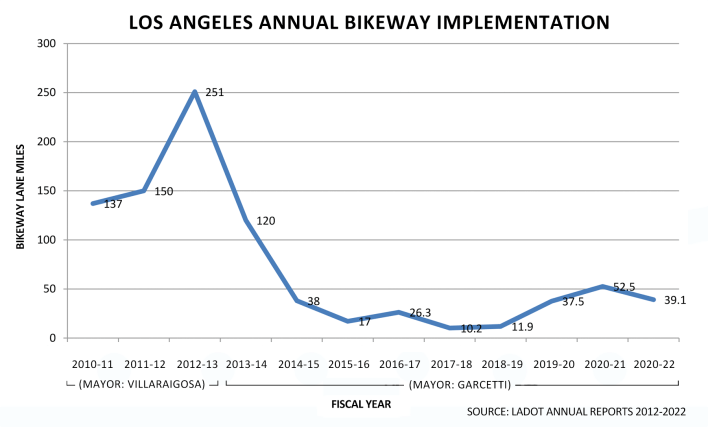
LADOT recently provided Streetsblog a spreadsheet showing Fiscal Year 2021-22 bikeway implementation. For FY2020-21, L.A. City saw just 39.1 lane-miles of upgraded and new bikeways.
(Streetsblog's totals differ slightly from those reported by LADOT, which reported 38.5 lane miles. DOT did not include non-DOT projects like the Bureau of Engineering's new Taylor Yard bikeway bridge. See SBLA spreadsheet for details on discrepancies. SBLA numbers are used throughout this article.)
As noted in past posts (see FY20-21 and FY19-20), not all bikeway miles are equal. Quality protected bikeways and bike paths serve riders aged 8 to 80, while sharrows (shared lane markings) are such a weak treatment as to serve almost nobody. New bikeway mileage expands the network, while upgrades to existing bikeways do not. Among upgrades, some are significant (converting unprotected lanes to protected ones) and others are nearly meaningless (adding a buffer to an existing lane). In some places, upgrades point to LADOT's failure to install the best/safest facility earlier. Also, many upgrades allow the city to double- and triple-count mileage when one street first gets, say, sharrows, then a bike lane, then a buffered bike lane, then a protected bike lane.
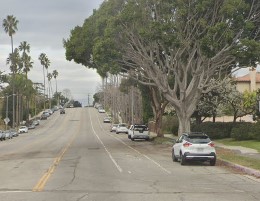
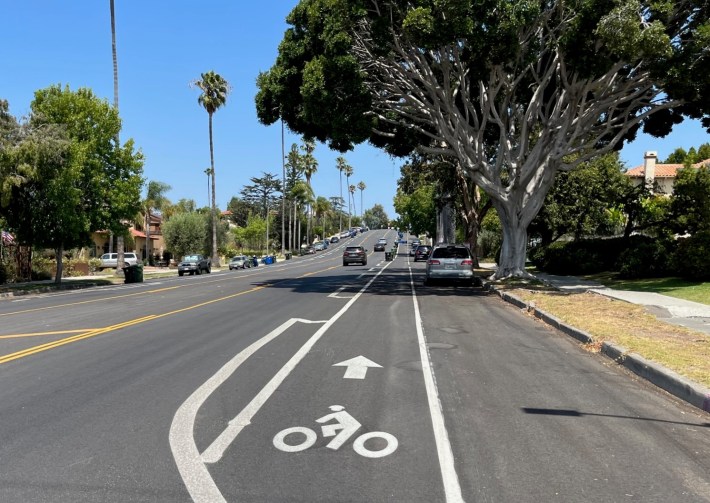
About a quarter of the total bikeway miles LADOT reported last year (9 out of 39 miles) were existing bike lanes that got the nearly meaningless addition of an extra buffer stripe.
Another fourteen percent (nearly 4 miles) are streets where the city added sharrows. Sharrows, known as the dregs of bike facilities, do have a few appropriate uses. But some studies have found sharrows can be less effective than no treatment.
Yes, the city probably should do these sorts of inexpensive marginal upgrades. No, they won't make a meaningful difference for anyone.
LADOT's FY21-22 total of 39.1 miles breaks down into 26.6 miles of new bikeways and 12.5 miles of upgrades to already existing bikeways. Last year, there were 31.8 new lane-miles and 20.6 miles of upgrades.
Among the new bikeways are:
- 2.86 miles of new bike paths (11 percent)
- 3.63 miles of new protected lanes (14 percent)
- 7.66 miles of new buffered lanes (29 percent)
- 8.67 miles of new conventional lanes (33 percent)
- 3.78 miles of new sharrow-ed routes (14 percent)
As SBLA noted in past years, it is informative to look at two types of good quality facilities:
- New Lane Miles - new bike lanes (conventional, buffered, or protected) and paths. This year LADOT installed 22.8 new lane miles. Last year new lanes totaled 26.9 miles, the prior year 11.3 miles, and the year before that 4.7 miles.
- Significant Upgrades – upgrades that add protection to existing unprotected bike lanes. This year LADOT upgrades added protection to 3.2 miles of existing bike lanes. The prior years saw 7.8 miles, 8.7 miles, and 4 miles.
So, FY21-22 saw 39.1 total miles (with ~26 quality miles) which is a step down from last year's ~52 total miles (with ~34 quality miles), but still just above the prior year's ~37 total miles (with ~20 quality miles).
For the past three years, the city did somewhat better than the prior four awful years. But, as SBLA opined last year, it sure isn't a portrait in courage, nor an adequate response to a climate emergency that calls for big shifts in transportation.
As with the prior two years, a lot of upgraded and new bikeway mileage is tied to street resurfacing. This means that where councilmembers are not overly hostile to bikeways, the city will sometimes add new bike lanes (or, more often, add buffers to existing bike lanes) during resurfacing. Safe streets advocates are pushing for the city to adopt Healthy Streets L.A., which would mandate that the city always implement approved bus and bike lanes when it resurfaces streets. The L.A. City Council will vote on Healthy Streets L.A. tomorrow. If they do not approve it, the measure will go to voters in 2024.
Typically, Streetsblog acknowledges city councilmembers that have shown leadership in bikeway implementation at this point. There really aren't any stand-out council leaders that have implemented a great deal of courageous bikeway mileage above and beyond the basics of what would fit easily with no (or minimal) space reallocated from cars. Nonetheless many of the more bike-friendly councilmembers - Nithya Raman, Mike Bonin, Monica Rodriguez, Kevin de León, and Bob Blumenfield - deserve credit for a decent amounts of quality bikeway mileage in their districts.
Similar to earlier posts, the run-down of many of the city's upgraded and new bikeways is sorted into categories: the good, the meh, and the bad.
The Good
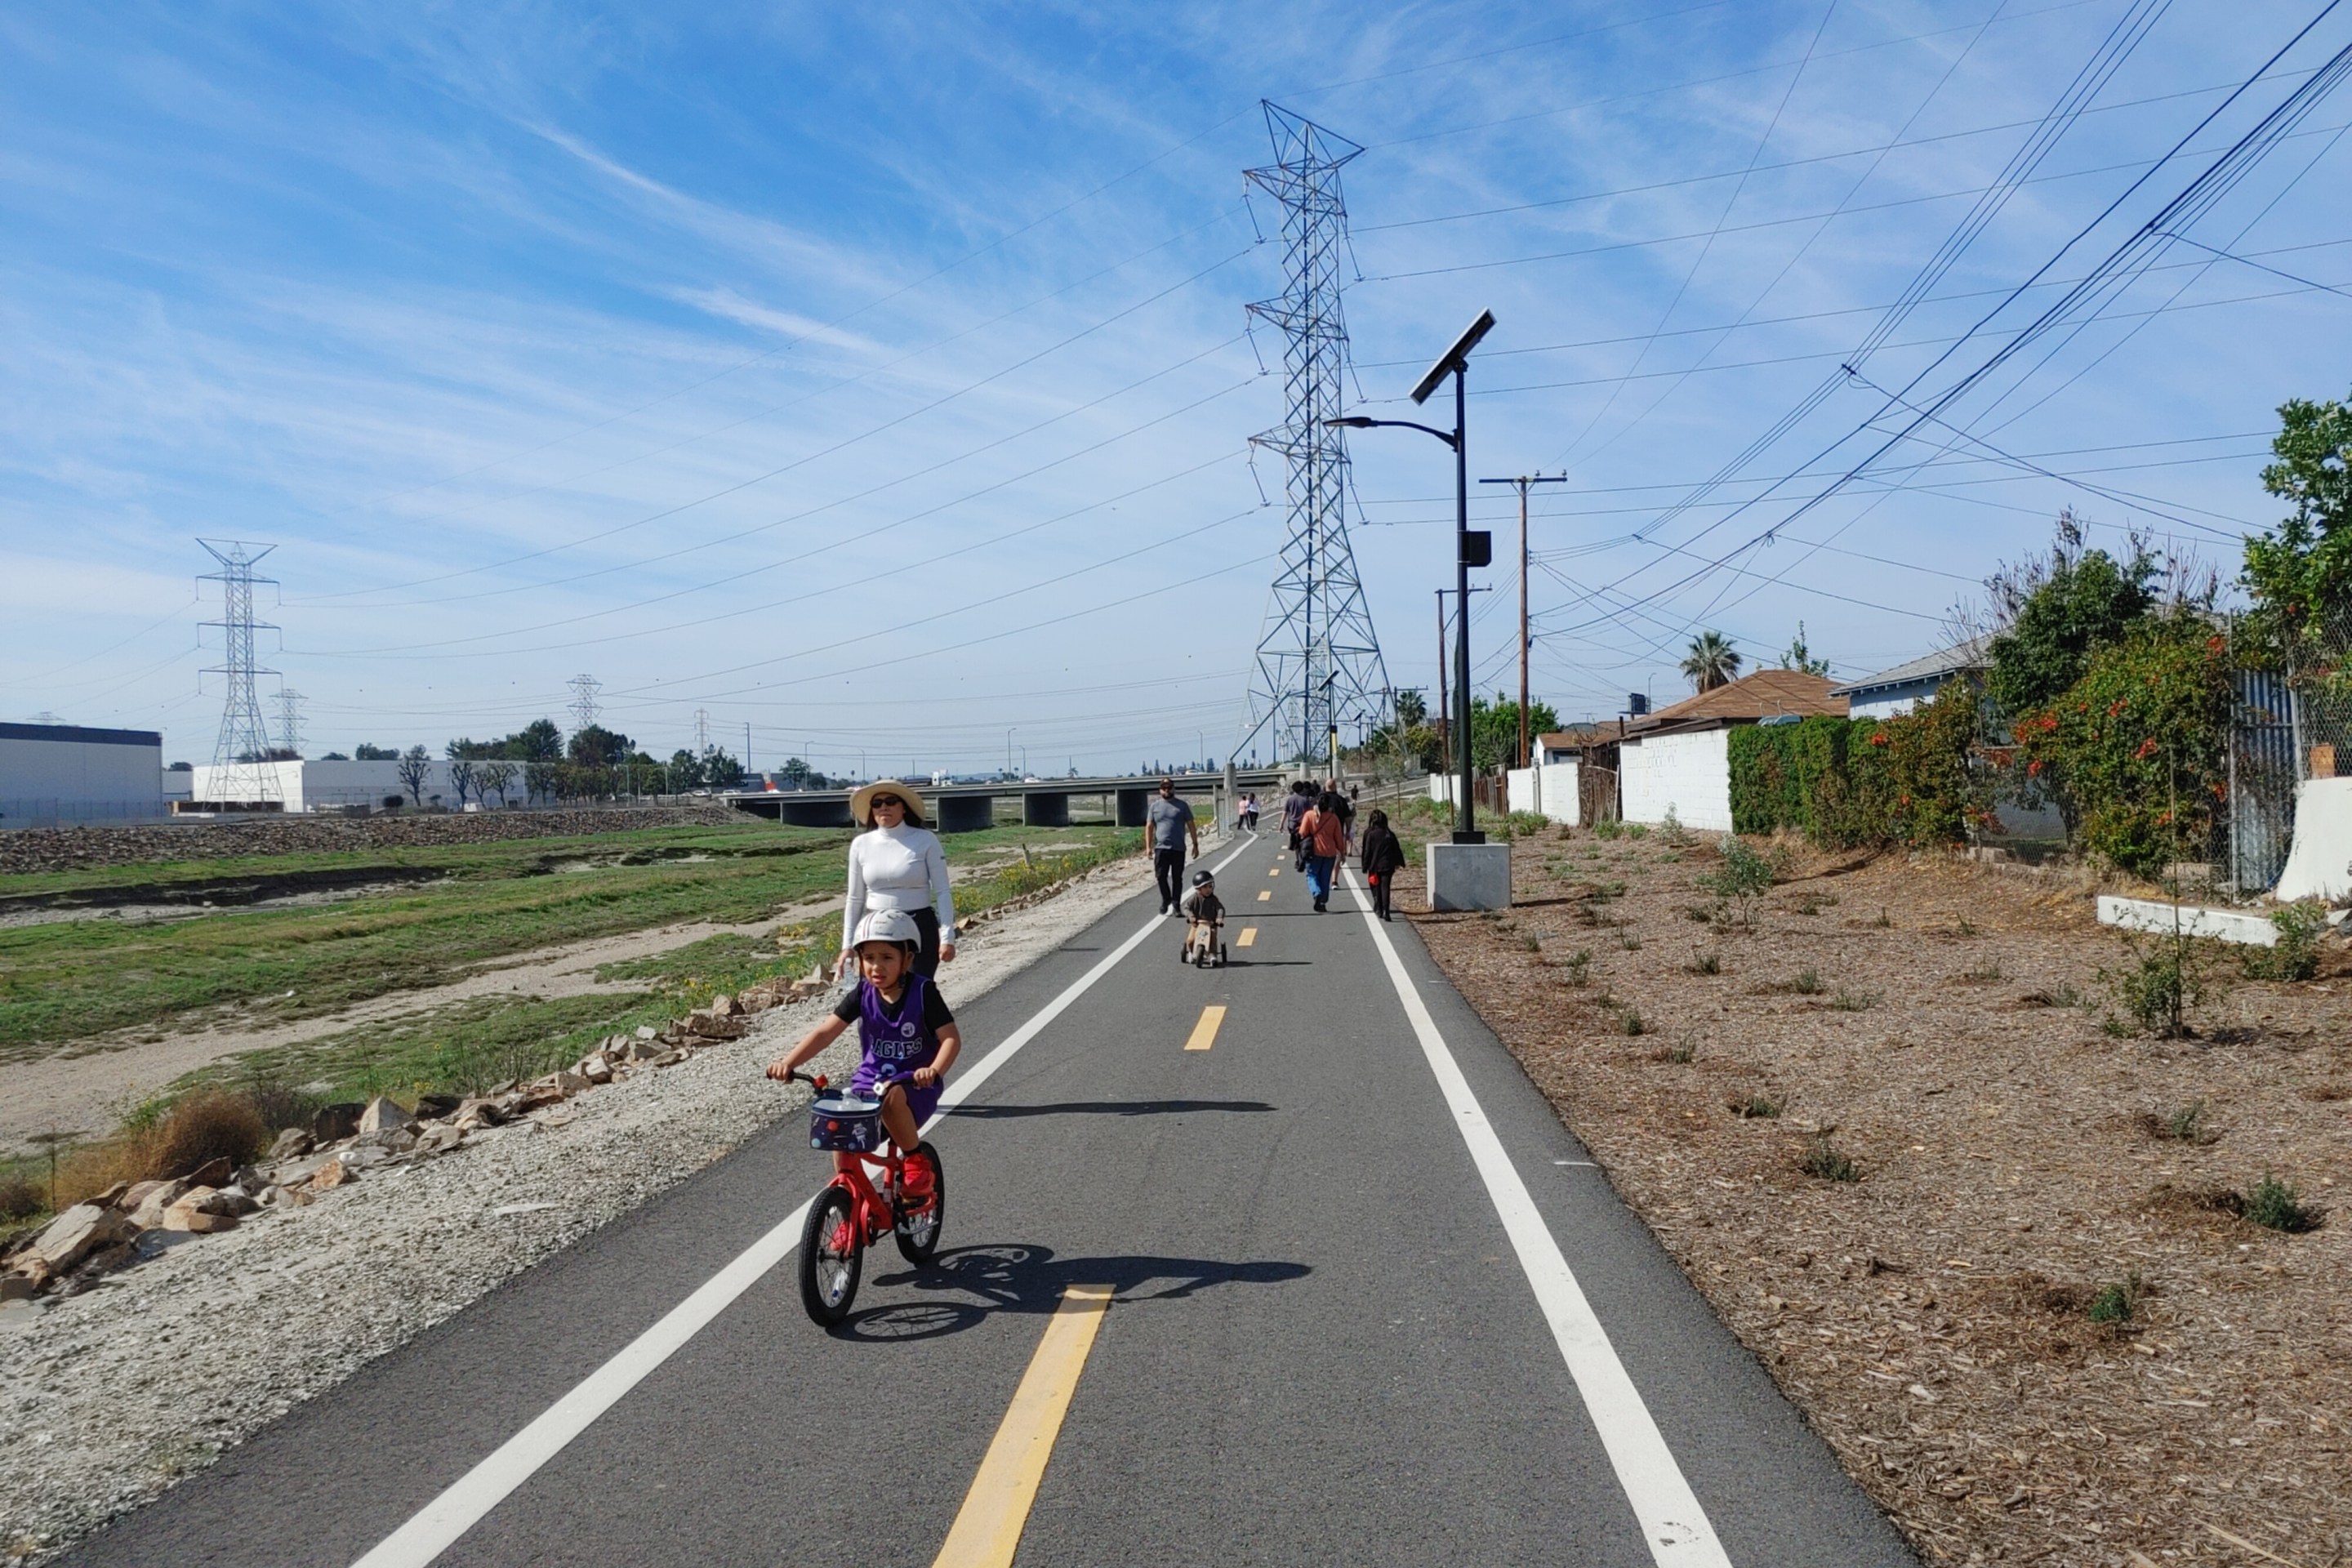
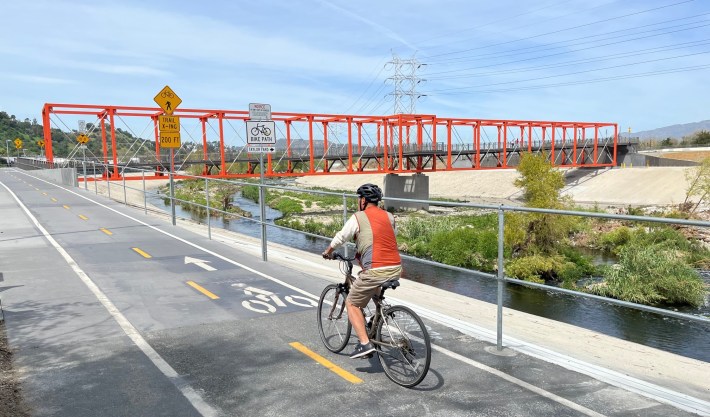
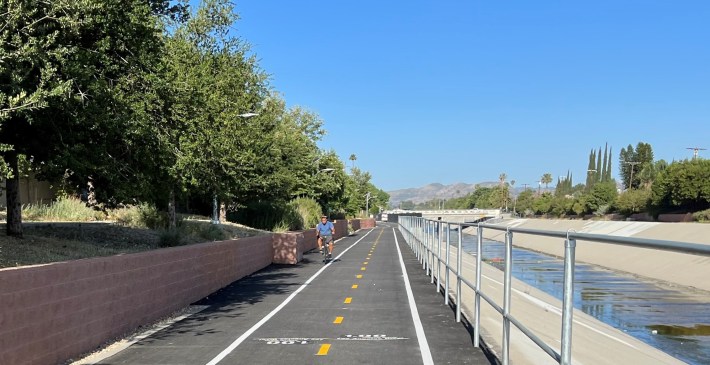
The city's L.A. River bike path saw two new facilities open this past spring: the Taylor Yard bike bridge in Elysian Valley and the 1.3-mile path at the river's headwaters in Canoga Park.
LADOT expanded the city's nascent protected bikeway network with new protected bike lanes installed on 1st Street, Airport Boulevard, Grand Avenue, and Riverside Drive, and new protection added to existing bike lanes on 2nd Street, Manchester Avenue, Sherman Way, and Winnetka Avenue.
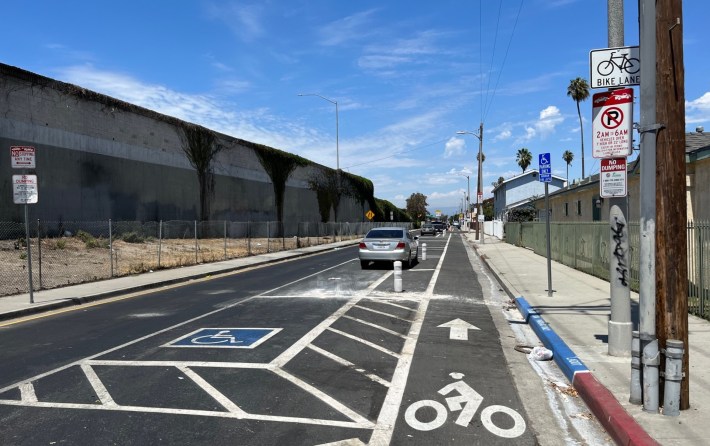
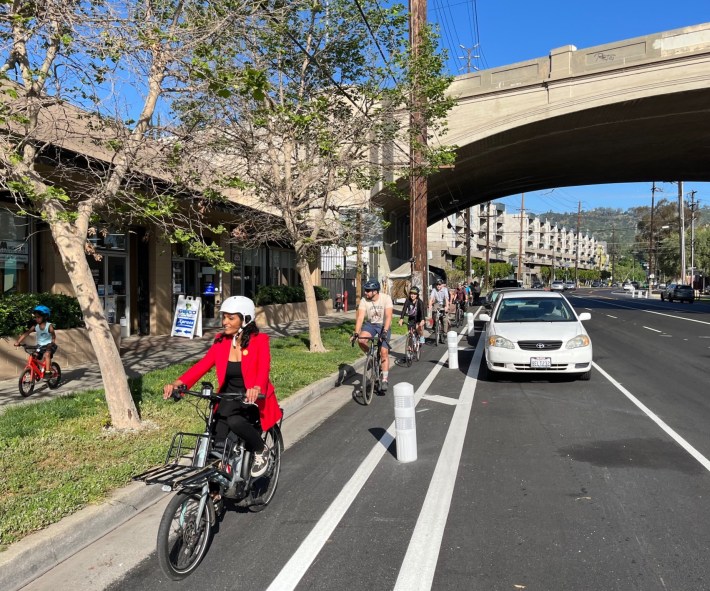
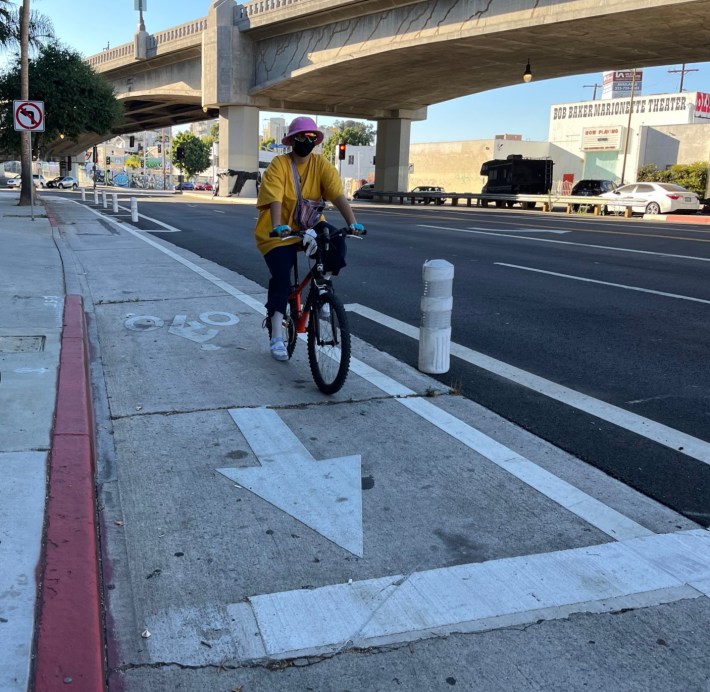
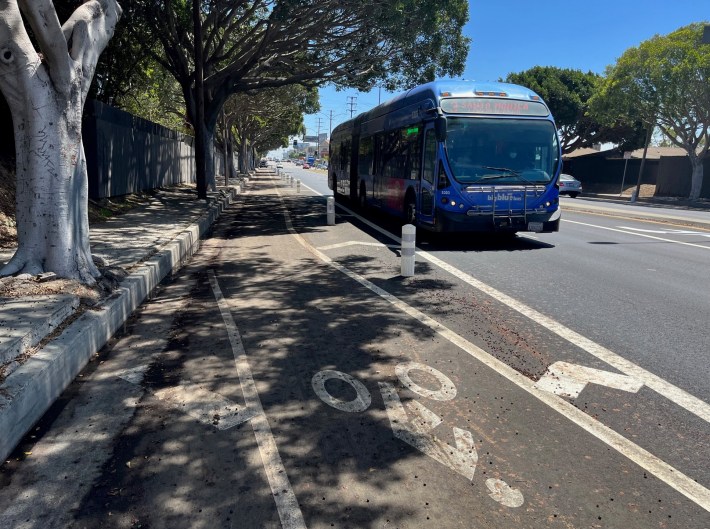
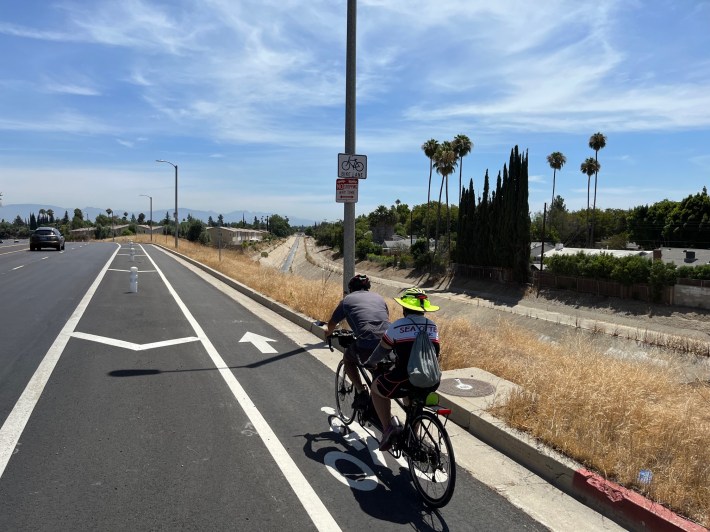
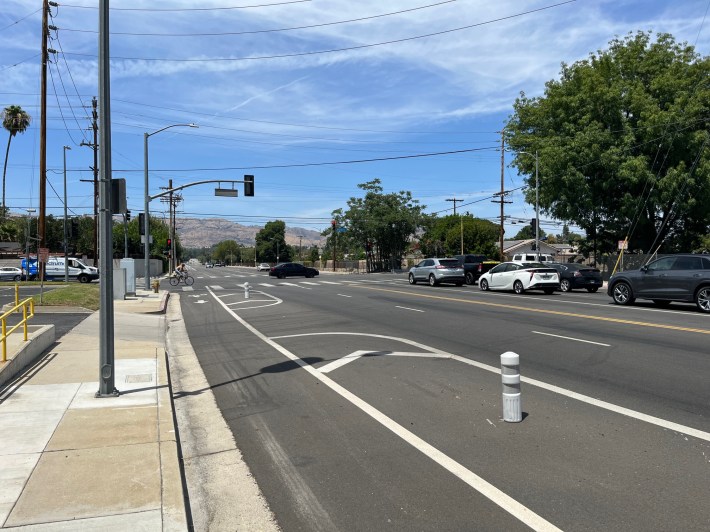
The two-mile long new buffered bike lanes on Adams Boulevard were part of a larger multi-faceted safety project.
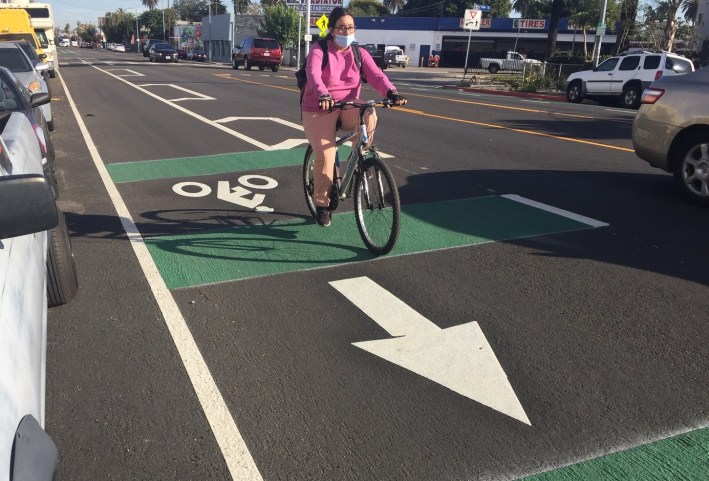
Several new bike lanes (some buffered) added worthwhile connections with existing bikeway networks: Burbank Boulevard, Channel Road, Colfax Avenue, N. Figueroa Street, Foothill Boulevard, Mission Road, Tujunga Avenue, and Yosemite Drive.
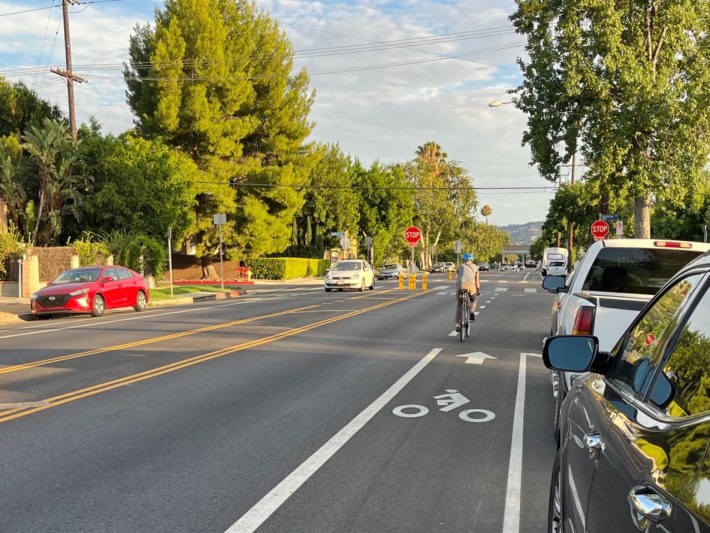
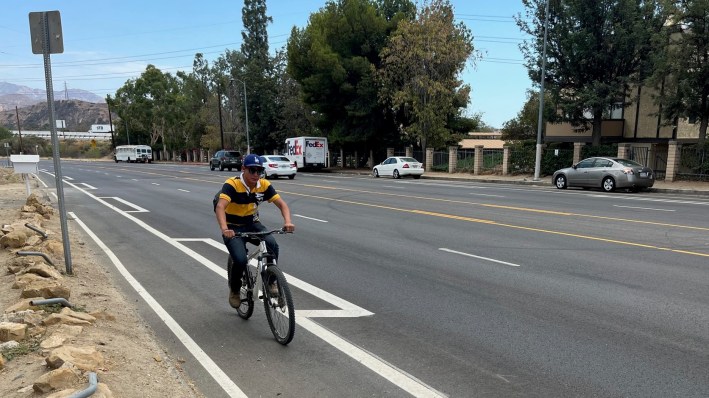
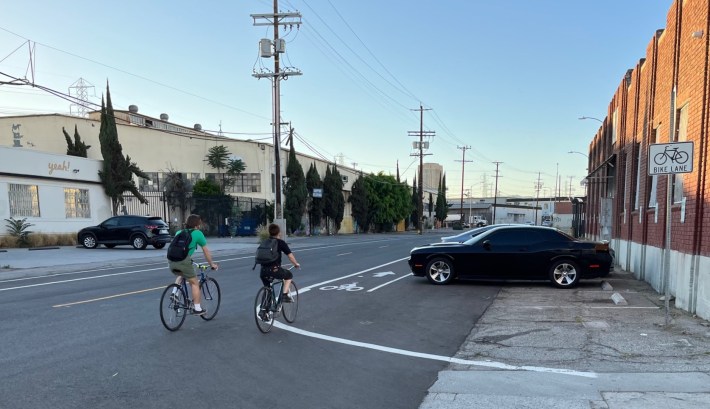
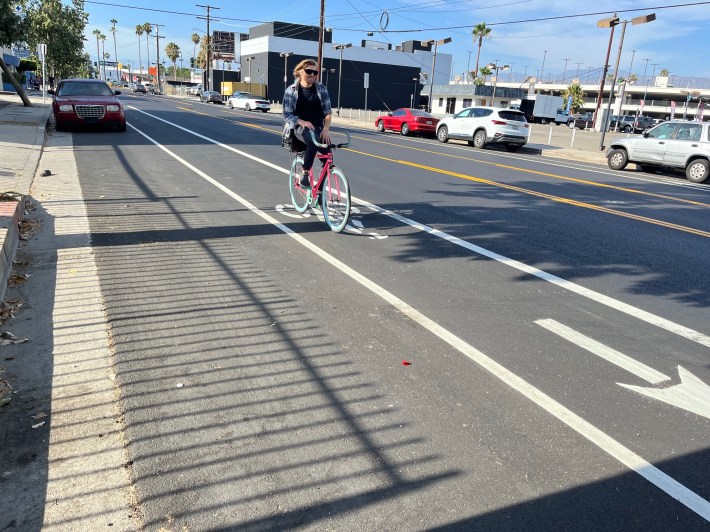
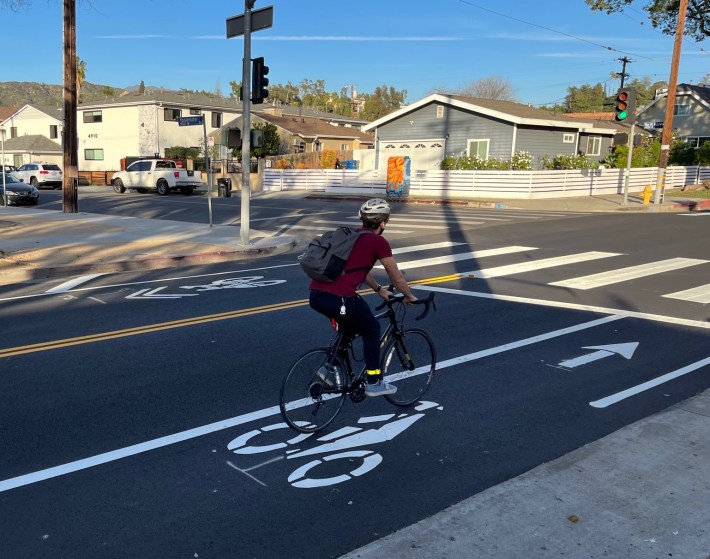
A few other new bike lanes were more opportunistic - worthwhile, but mostly adding bikeways on wider streets where space permitted (as opposed to where lanes might be more needed): Bellevue Avenue, Brookhaven Avenue, Idaho Avenue, and La Tuna Canyon Road.
The Meh
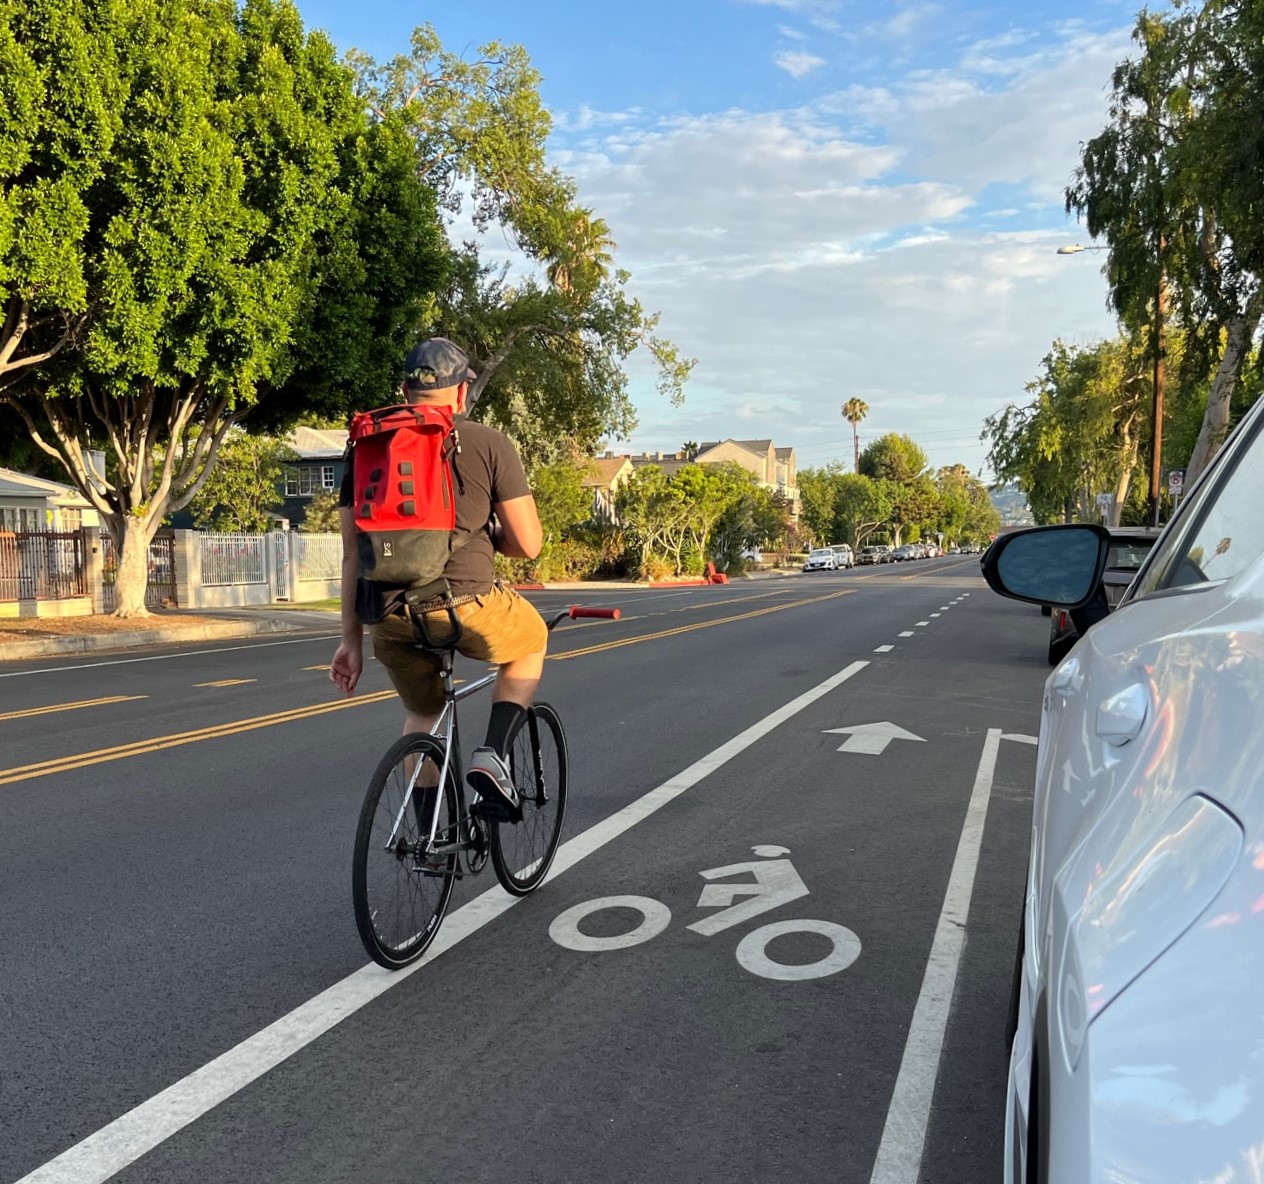
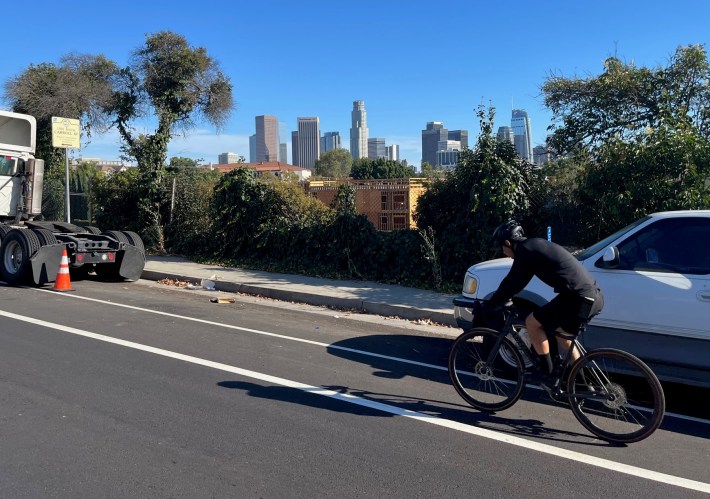
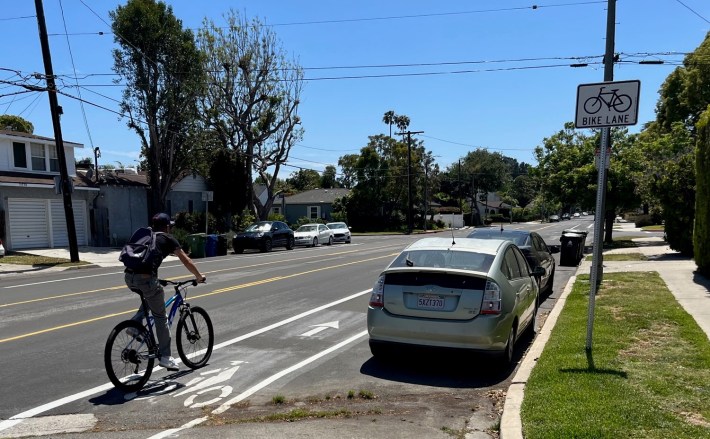
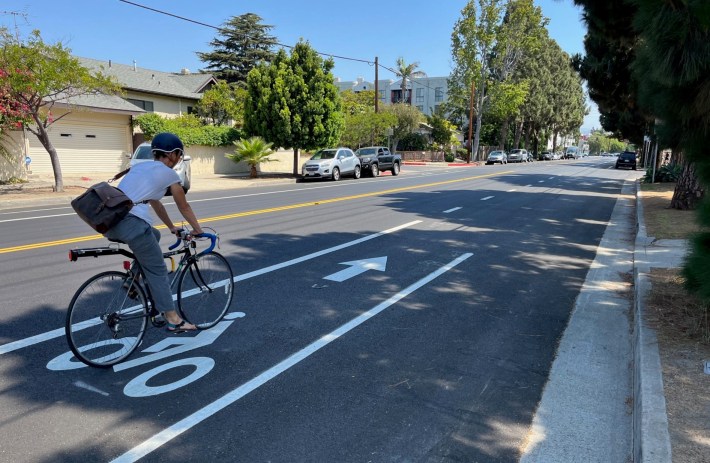
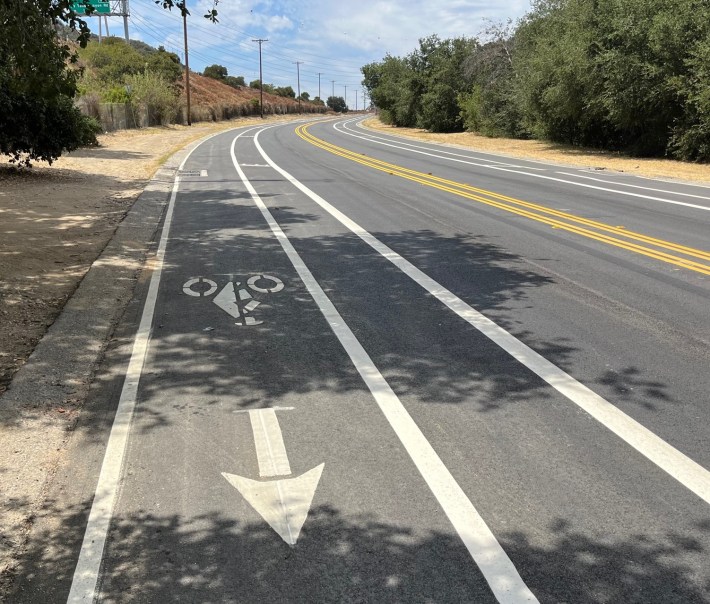
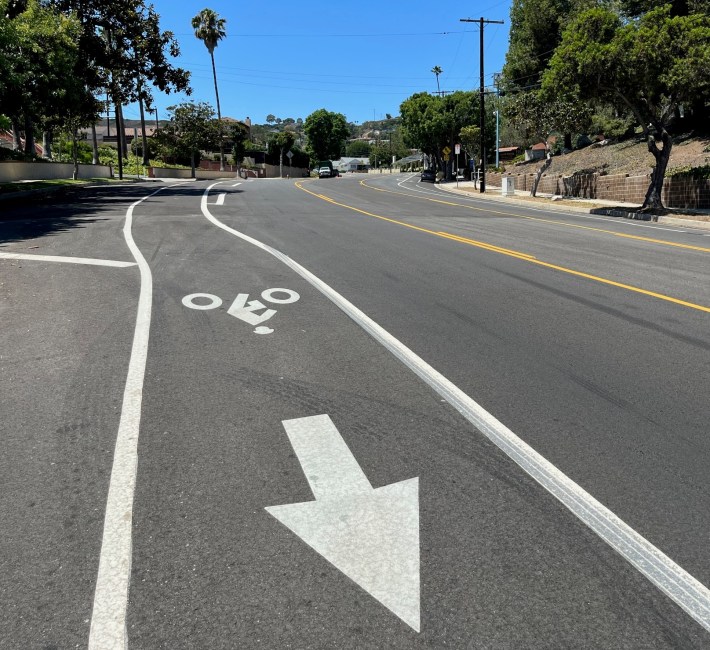
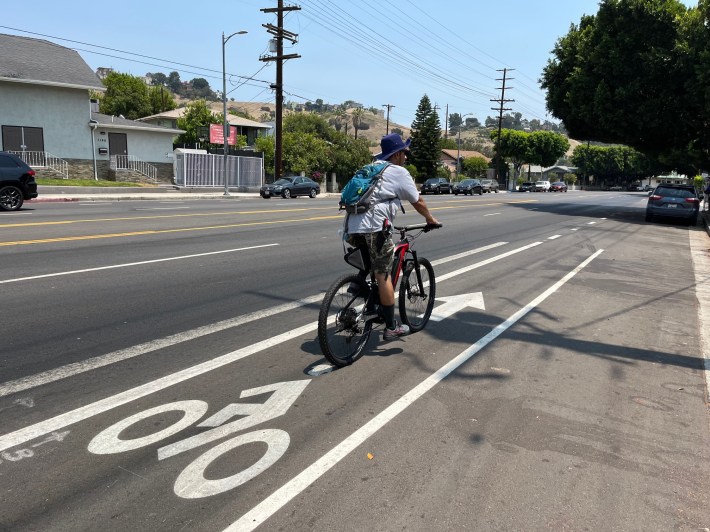
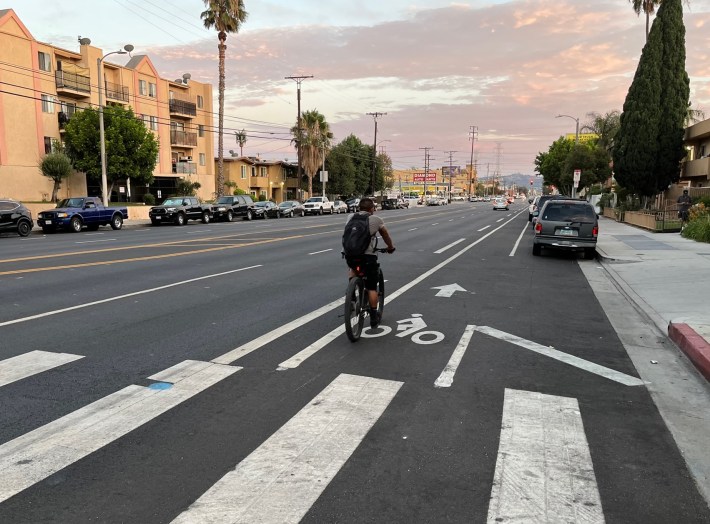
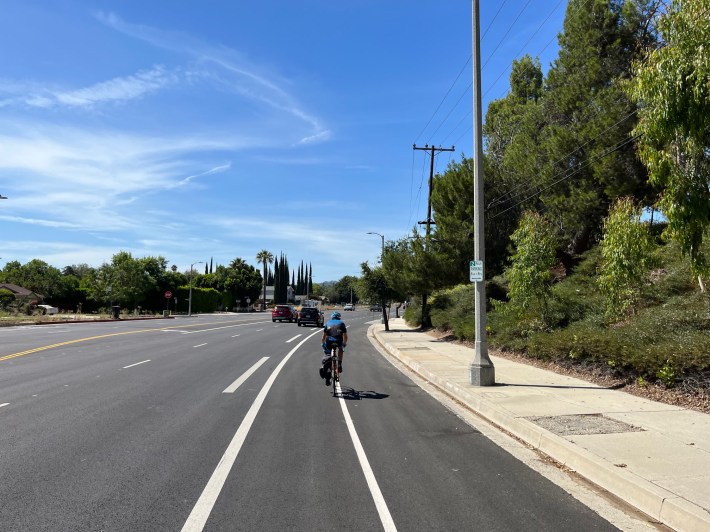
As noted above, about a quarter of FY20-21 LADOT bikeway mileage was adding new buffers to existing bike lanes - a very minor step in the right direction. These meh upgrades included meh buffers on 2nd Street, 9th Street, Avenue 50, Bluff Creek Drive, Cypress Avenue, Foothill Boulevard, Grand View Boulevard (shown above), Laurel Canyon Boulevard, Valley Circle Boulevard, and York Boulevard.
The Bad
You guessed it. Here is where Streetsblog mainly runs down the city's newest sharrows.
LADOT installed sharrows arguably appropriately to get some of the above-listed bikeways through a number of narrow-ish pinch points. These included short sharrow stretches on Bellevue, Channel, Idaho, Grand/84th/Olive, Mission, Tujunga, and Yosemite. Those sharrows were better than completely dropping those bikeways, but not much better.
In FY20-21, LADOT installed just one new sharrow-ed bike route - on Brunswick Avenue in North Atwater Village.
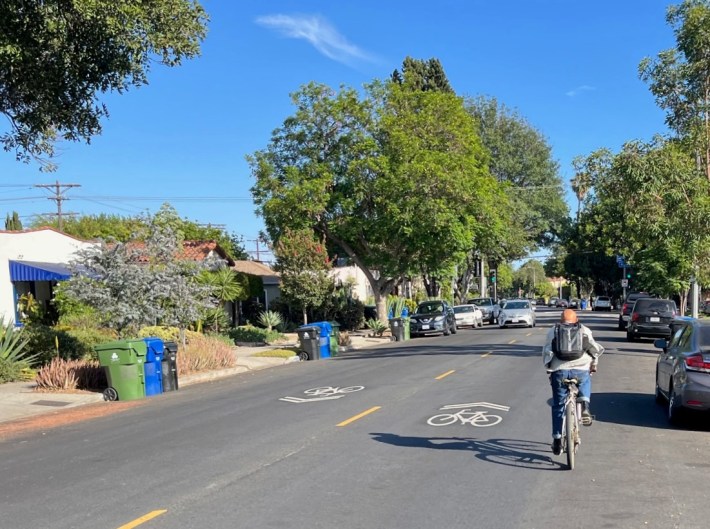
LADOT also added northbound sharrows opposite a one-way southbound bike lane on 2nd Avenue in South L.A.’s Hyde Park neighborhood.
See also SBLA coverage of earlier annual LADOT bikeway implementation: FY20-21, FY19-20 , FY18-19, and FY15-16. Thanks to Michael MacDonald for graphing these each year.
