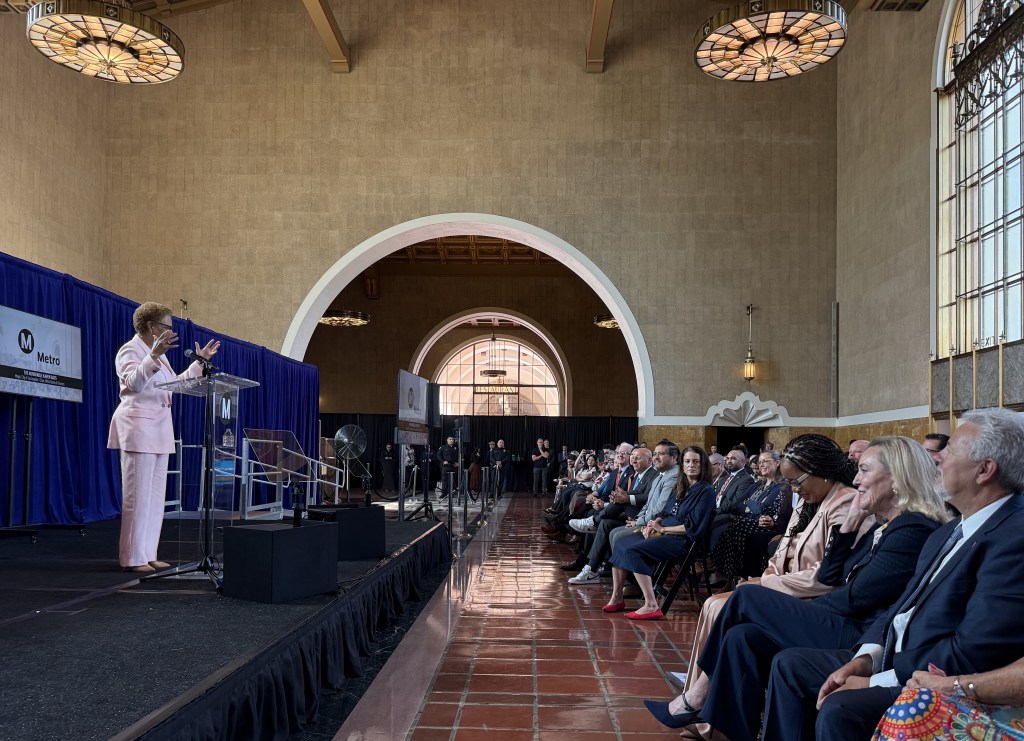
CEO Wiggins Pledges to Restore Metro Ridership to Pre-COVID Levels by July 2023
At last week’s State of the Agency event, Metro CEO Stephanie Wiggins pledged to increase Metro transit ridership back to pre-pandemic levels in the coming year.
Wiggins stated that the transit customer experience will be central in her work this year, noting, “Our system will be noticeably cleaner, safer, and more reliable to you, our customers, so that you can have confidence in choosing Metro.” The CEO stated her top goals for this year include “restor[ing] ridership to pre-pandemic levels by the next State of the Agency [July 2023]. That means we will see an increase in ridership from the 789 thousand to 1.2 million average weekday riders.” Wiggins outlined several factors that will help grow ridership, “I believe we can get there because we are opening more than ten miles of new rail service this year. We’re restoring service on our bus lines. And we’re making a significant investment in making a fast, clean, reliable, and safe system.”
Recent Metro service and ridership statistics show what Wiggins and Metro’s riders already know: reaching this critically important goal won’t be easy.
At the outset of the pandemic, Metro transit ridership fell to roughly one-third of pre-COVID levels.
Due to interrelated factors – pandemic surges, bus operator shortages, and reduced/inconsistent service (more on these below), current ridership has only recovered to about two-thirds of pre-COVID levels.
Metro ridership rebounded largely in between the heaviest COVID surges – the largest of which took place during the last two December-January periods. To date, Metro’s COVID-era high mark was in November 2021, when the system carried 71 percent of pre-COVID ridership.
As of last month, overall boardings were at 66 percent of pre-COVID numbers.
Metro bus ridership declined less – and rebounded more quickly – compared to Metro rail. As of May, buses are carrying 71 percent of pre-COVID levels, while rail is seeing 55 percent.
In September 2020, responding to the outset of the pandemic, Metro cut transit service by twenty percent. Despite a board directive (and funding) for restoring pre-pandemic service levels, Metro operations have struggled to restore service to what they were able to deliver in 2019. After a couple delays, full transit service was scheduled to be restored in September 2021. At that time Metro claimed that full ‘scheduled’ service had been restored, but bus run cancellations were running at more than ten percent, meaning less service than promised, operating unreliably, and stress to a remaining operator workforce that Metro had neglected to replenish.
In a devil’s bargain, Metro again cut service 10-12 percent in February 2020, promising better reliability. Reliability improved; canceled bus runs dropped from over ten percent to around two percent. But bus riders endured reduced service, which was still less reliable than it had been pre-pandemic. Last month, Metro restored some additional service, though overall service hours remain about ten percent below pre-pandemic service.
Data crunched and graphed by L.A. transit rider Ian Rose (posted to Twitter in a very informative thread) show a finer picture of recent Metro bus service and cancellations.
Rose’s graph illustrates the difference between Metro’s scheduled bus service (flat upper edge of blue area of the above graph) and actual service (scheduled service minus cancellations – shown in the lower sawtooth-shaped edge of the blue area). Rose notes that his graphs show just weekday buses, not including night owl service.
The data makes clear what Metro riders have been experiencing. Metro bus service was indeed plagued with onerous levels of cancellations prior to the February service cut (thick blue area on left). The cuts did result in fewer cancellations (thinner blue in center). And, just a couple weeks in, June’s modest service increase appears to have brought back somewhat higher cancellation levels, though it’s probably too early to state this conclusively (hopefully Metro is remedying the situation).
Rose’s thread includes finer detailed graphs showing individual bus lines that do or don’t follow overall trends. Below are few example graphs showing Metro service on Vermont Avenue, Western Avenue, and Santa Monica Boulevard.
Rose points out various other informative examples:
- Several downtown-serving lines had less drastic cuts, and were mostly restored in June: 2 (Sunset), 16 (Third), 28 (Olympic), 33 (Venice), and 51 (Avalon)
- Many other downtown-serving lines did not have service significantly restored in June
- Line 205 (Wilmington) is seeing more cancellations now than before February cuts
- Line 125 (Rosecrans) is also seeing more cancellations now than before February cuts, and had its service cut in June, when most lines had service increased
- The worst cancellation rate in the system is line 603 (Glendale Galleria-USC), which had service further cut in June and is still seeing 25-30 percent canceled service of its service hours.
- Other lower-ridership lines had service cuts in June: 501 (Pasadena-North Hollywood), 577 (CSULB-VA Medical Center) and 605 (USC Medical Center)

Read More:
Streetsblog has migrated to a new comment system. New commenters can register directly in the comments section of any article. Returning commenters: your previous comments and display name have been preserved, but you'll need to reclaim your account by clicking "Forgot your password?" on the sign-in form, entering your email, and following the verification link to set a new password — this is required because passwords could not be carried over during the migration. For questions, contact tips@streetsblog.org.