Note: GJEL Accident Attorneys regularly sponsors coverage on Streetsblog San Francisco and Streetsblog California. Unless noted in the story, GJEL Accident Attorneys is not consulted for the content or editorial direction of the sponsored content.
California has been doing pretty well reducing its emissions so far. The state reached its 2020 climate goals four years early, even while growing the state economy. But it started with the easy stuff, largely by replacing electricity sources with renewables like hydroelectricity, solar, and wind.
Future goals, which are the ones that might actually affect climate change, are going to require a lot more work.
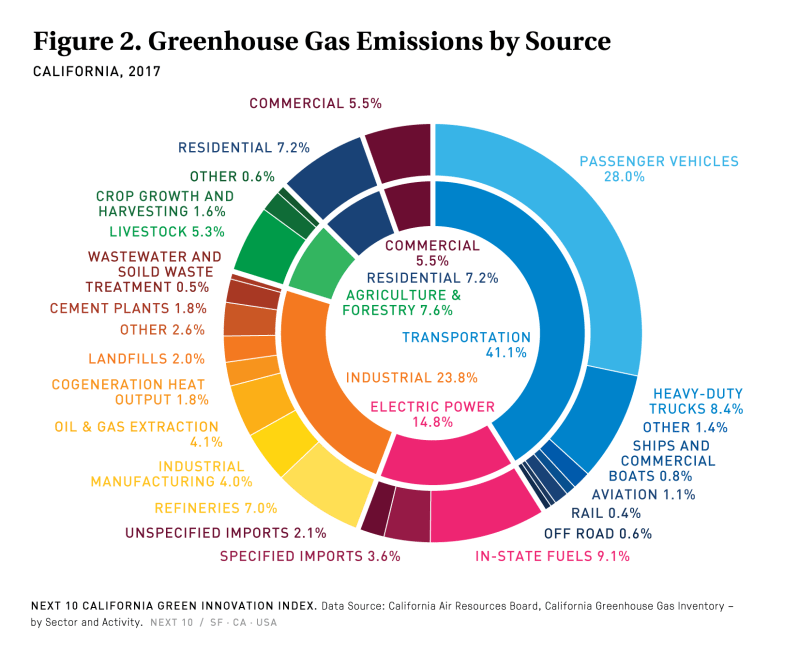
A just-released report from Next10 and Beacon Economics, the California Green Innovation Index, is a "blunt warning" that California has to pick up the pace on emissions reductions. Transportation is not the only sector that is failing to reduce emissions, but it is a big one - it accounts for more than forty percent of the state's total greenhouse gas emissions. And trends go in the wrong direction.
The Index reports that transportation emissions hit a record high in 2017, with more than half of that from passenger vehicles. More people own cars, and people are driving more.
State incentives and infrastructure funding have helped increase the number of electric vehicles on the roads, reaching about a half a million in 2018. With cleaner electricity and other efforts, like California's Low Carbon Fuel Standard, that means at least some of that increased driving is not contributing further to the climate crisis.
But people are also increasingly buying inefficient (and unsafe) vehicles, including SUVs, minivans, and pickup trucks. "By the fourth quarter of 2018, light-duty pickup trucks, mini-vans, and SUVs made up 57.3 percent of new vehicle registration, up from 54 percent from one year ago and 39.3 percent from five years ago," says the report.
That means that
...most GHG reductions from the transportation sector will need to come from the Low Carbon Fuel Standard (LCFS) and reducing vehicle miles traveled.
Since most of the current LCFS credits are for electric vehicles, that also means rapidly increasing the portion of EVs.
"Given that transportation is by far the largest-emitting sector—and with most of the emissions coming from on-road light-duty passenger vehicles—the current upward trajectory of VMT and surface transportation GHG emissions cannot continue if the state is to meet its climate goals," reads the report.
The decline in public transit ridership doesn't help matters. In most of California, ridership decreased between 2008 and 2018 - by 8.9 percent in San Francisco and 34.3 percent in Fresno, for example. However, the report shows that in at least three rural areas, "unlinked passenger trips" went up in 2018: Hanford–Corcoran, Bakersfield, and Merced. Other parts of the country have seen increases in public transit ridership, including New York and Seattle, so declining public transit ridership is not something that has to be accepted as an inescapable circumstance.
Specifically, the report found that:
- The annual increase in transportation emissions has slowed down slightly compared to the previous three years.
- Per capita driving and GHG emissions from surface transportation increased 0.5 percent and 0.1 percent, respectively, from 2016 to 2017. Miles driven have been increasing gradually for years in California.
- The faster increase of miles driven than GHG emissions indicate that the state’s fuel economy standards and policies are working, to some extent.
- In 2018, battery electric, plug-in hybrid, and hydrogen vehicles accounted for 1.5 percent of all registered on-road vehicles in California. At the current rate of adoption, the share will reach two percent by the end of 2019.
- The vehicle ownership rate is increasing faster than ever, reaching 80.6 vehicles per 100 persons in 2018. ZEVs and hybrids accounted for about 4 vehicles per 100 persons.
Transportation is not the only sector that needs work. While the electricity sector has greatly decreased its reliance on fossil fuels, emissions from others have increased lately. Waste management emissions are increasing, as recycling rates are falling and the amount of waste going to landfills rises. The Next 10 report also goes into detail about emissions from wildfires, which are not even tracked by the Air Resources Board.
But transportation emissions remain a huge challenge. At least three potential policy options jump out here:
- Drive less.
- Drive less.
- Drive less.
- Consider a ban on SUVs, or find a way to curtail the sale and use of light-duty trucks as passenger vehicles.
- Study areas that have been able to increase public transit ridership and apply those lessons to California, including bigger investments than we have until now been willing to make.
The Next 10 report, downloadable here, is a treasure trove of facts and charts about what California's climate goals are, how those goals are supposed to be achieved, and where policy and regulation are failing.
