Long Beach Post Maps Pedestrian Crashes
This story originally appeared on LongBeachize at the Long Beach Post. To read the original post, or work with the interactive map, click here.
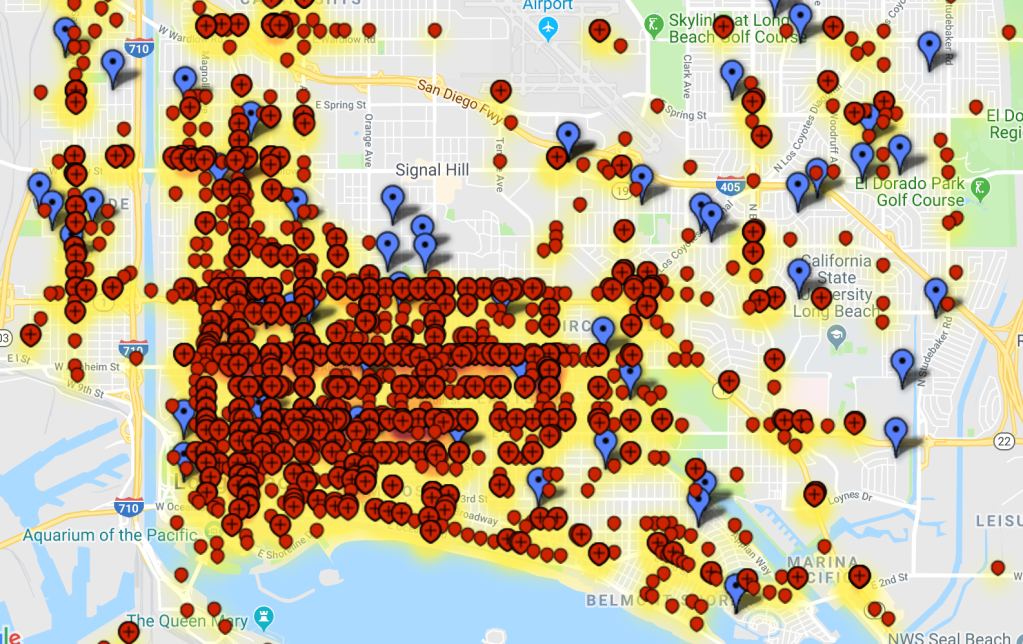
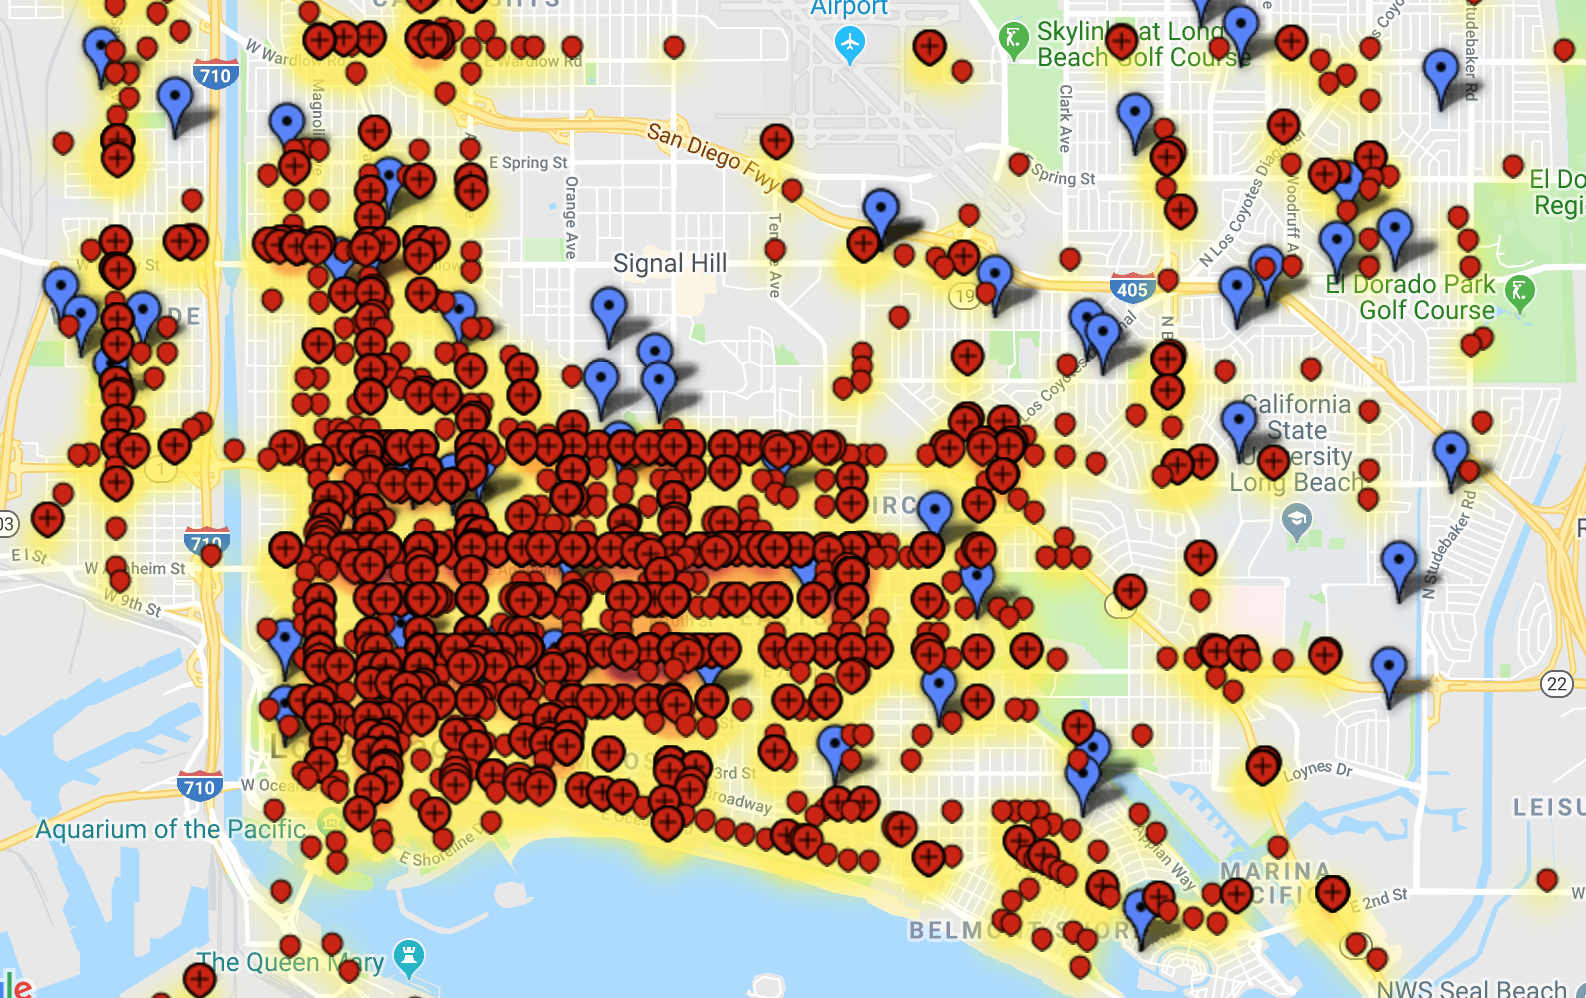
Over the past five and a half years, there have been almost 2,000 times when someone walking through Long Beach was hit by a car, motorcycle, bicycle or other type of vehicle.
There were 1,982 traffic collisions that involved pedestrians reported to the Long Beach Police Department between Jan. 1, 2013 and July 1, 2018.
As part of its Safe Streets series, the Long Beach Post mapped each of those crashes to help readers gain perspective on one of the challenges residents face getting around by foot in the city’s neighborhoods.
The heat map shows how concentrated those crashes are in certain areas of the city.
You can also zoom in and click any red pin with a + sign to expand it and see all the incidents at that location. Click a single pin to see the date of that specific crash.
All locations are approximate down to the 100-block number or intersection.
The blue pins indicate schools.
The Long Beach Post obtained the data used for this map through a California Public Records Act request to the Long Beach Police Department.
If you notice any erroneous data or have any questions, please email us at editor@lbpost.com.
Map created by Dennis Dean.

Streetsblog has migrated to a new comment system. New commenters can register directly in the comments section of any article. Returning commenters: your previous comments and display name have been preserved, but you'll need to reclaim your account by clicking "Forgot your password?" on the sign-in form, entering your email, and following the verification link to set a new password — this is required because passwords could not be carried over during the migration. For questions, contact tips@streetsblog.org.