Metro is currently considering some pretty big bus service changes. Basically Metro is considering a cost-neutral scheme that would eliminate multiple relatively low-performing bus lines and would add more frequent service on a core network. More details below. Overall it looks like a step in a positive direction, though the devil may be in the details.
And the details are few and far between.
Though Metro has released a very basic presentation [PDF] with some maps and lists, the proposal seems to be in flux. Metro's maps and lists don't match. There are a lot of questions left unanswered.
How Metro's Proposal Came About:
In March, Metro received the recommendations from an American Public Transit Association (APTA) review by a national panel of transit experts. On the operations end, the APTA review recommended more frequent bus service on a sparser network. The review also recommended more space between bus stops and a greater "load factor" (more people per bus) on somewhat crowded peak-commute-hour bus service.
The APTA recommendations dovetailed with changes that were already being considered. Metro convened a "Blue Ribbon Committee" (BRC) which reviewed Metro staff's development of a bus service reorganization plan, called Metro's "Draft Transit Service Policy" [PDF].
What's In Metro's Proposal:
To date, no full thorough documentation of Metro's proposal has been made available, so the public has to read between the lines of Metro's slideshow summary [PDF]. Calwatch posted a good summary of the proposal at Reddit.
On balance, the overall proposal has "no additional hours" of bus service. So where Metro would add more frequent service on many lines, it would subtract the same amount of service from other lines.
To evaluate how well bus lines are doing, Metro developed a metric it calls Route Performance Index (RPI.) The higher the RPI, the better the line is performing. RPI combines three measurements:
- how many people use a line (passengers/service hour)
- how far people travel on a line (passengers/seat mile)
- overall operational cost (net cost/passenger)
These values are normalized so that a score of 1.0 matches the overall average. Better Institutions obtained a full RPI listing for Metro's 140 transit lines (though the list does not include rail or BRT, and buses on Wilshire Blvd are now considered BRT). Metro's highest ridership line, the 254 on Vermont Avenue, scores an RPI of 1.69, while the agency's worst line, the 607 in Windsor Hills-Inglewood, scores an RPI of 0.27. According to Metro, lines with an RPI less than 0.6 "are subject to remedial action."
Where Bus Service Would Be Improved:
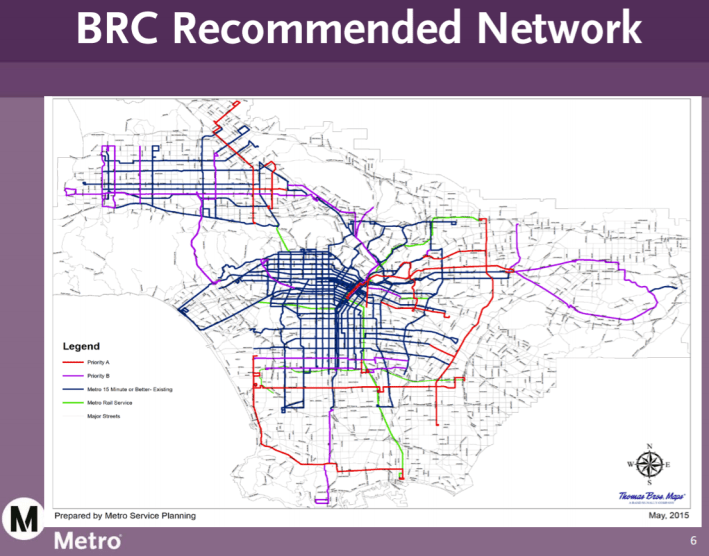
According to Metro's "BRC Recommended Network" map, the following bus lines would run more frequently. Service on these lines would be improved to run at least every 15 minutes at peak times of the day (listed in Calwatch's order - generally east to west and north to south):
Priority A (mapped in red)
- Laurel Canyon Blvd - 230 (San Fernando Valley) [RPI 0.86 - 59th]
- Vineland Avenue - 152 (San Fernando Valley) [RPI 1.06 - 26th]
- Vanowen Street - 165* (East Valley) [RPI 0.87 - 56th]
- Rosemead Blvd, Lakewood Blvd - 266 (San Gabriel Valley) [RPI 1.29 - 10th]
- Main Street, Valley Blvd - 76 (DTLA to San Gabriel Valley) [RPI 0.97 - 35th]
- Main Street, Las Tunas Drive - 78/378* (DTLA to San Gabriel Valley) [RPI 0.83 - 66th]
- Alameda Street - no current Metro bus (DTLA)
- Olympic Boulevard - 66 (East L.A.) [RPI 1.14 - 18th]
- Eastern Avenue - 256* (Commerce to Cal State L.A.) [RPI 0.61 - 108th]
- Pacific Coast Highway - 232 (LAX to Long Beach) [RPI 0.89 - 52nd]
- Florence Avenue 111/311* (South L.A. to Southeast L.A. County) [RPI 1.18 - 16th]
- Compton Avenue 55/355 (DTLA to South L.A.) [RPI 0.86 - 58th]
- Rosecrans - 125 (Manhattan Beach to Compton to Norwalk) [RPI 0.94 - 42nd]
Priority B (mapped in purple)
- Victory Blvd - 164 (San Fernando Valley) [RPI 0.79 - 73rd]
- Topanga Canyon Blvd - 245 (West Valley) [RPI 0.64 - 100th]
- DeSoto Avenue - 244 (West Valley) [RPI 0.64 - 100th]
- Tampa Avenue - 242 (San Fernando Valley) [RPI 0.61 - 109th]
- Glenoaks Blvd, Brand Blvd, Glendale Blvd - 92 (Burbank-Glendale to DTLA) [RPI 0.78 - 77th]
- Glendale Avenue - 91* (Glendale to DTLA) [RPI 0.83 - 67th]
- Van Nuys Blvd, 405 Freeway - 788 (Valley to Westwood) [RPI 0.81 - 72nd]
- San Vicente Blvd - 330 (West Hollywood to Mid-city to DTLA) [RPI 0.89 - 51st]
- Santa Anita Avenue - 487 (San Gabriel Valley) [RPI 0.75 - 87th]
- Ramona Blvd - 190 (San Gabriel Valley to Pomona) [RPI 0.61 - 110th]
- Valley Blvd - 194 (San Gabriel Valley to Pomona) [RPI 0.61 - 110th]
- First Street - 30* (Boyle Heights) [RPI 0.89 - 51st]
- Century Blvd - 117* (LAX to South L.A.) [RPI 0.97 - 36th]
- Imperial Highway - 120* (LAX to South L.A.) [RPI 0.59 - 112th]
- Vermont Avenue, Gaffey Street - 550 (South L.A. to San Pedro) [RPI 0.74 - 86th]
*The asterisked lines appear to be only partial. The full extent of the line does not appear on the Metro frequent network map. For example, line 256 on Eastern Avenue today runs from Altadena to Commerce; but the frequent service improvement is shown only on the southern half of the route - from El Sereno to Commerce.
To add the more frequent bus service on the priority A and B lines would require a total of 116,000 new service hours.
In addition to the new service on lines listed as A and B priorities above, there are two additional categories of service that would be improved:
- An "Enhanced Rapid Bus Network" would add 142,000 new service hours.
- There are apparently Priority C and D lines neither mapped nor explained that would be "in later phases." Adding frequent service on C and D lines is quantified at 130,000 new service hours.
So the total new Metro bus service would be 388,000 new service hours (A&B 116,000 + C&D 142,000 + Rapid 142,000.) To "pay" for this, in a cost-neutral proposal, Metro would cut 388,000 hours of service from somewhere else.
Where Bus Service Would Be Cut:
To begin with, Metro would increase the load factor on its buses. The load factor is the measure of, on average, how crowded Metro buses are. Load factor is an average, and there is a lot of variability, so it does not mean every bus would have a lot more people standing, but it does mean that riders would get a bit more crowded, get a seat somewhat less often.
Transit expert Jarett Walker emphasizes maintaining a low load factor is very expensive for transit agencies. Walker states that crowding occurs "for short periods of peak demand" and minimizing crowding is expensive because Metro has "to pay drivers more to work very short shifts" and "the number of buses an agency must buy, store and maintain is based on the peak demand, not the all day demand."
So, Metro can allow slightly more crowding by running fewer peak hour buses on lines that are already running very frequently. The actual bus lines that would get slightly less peak service are not specified, but raising the load factor would cut a total of 40,000 hours of service.
The following "outside of service area" bus lines would be eliminated:
While the 460 bus does go outside L.A. County into Orange County Transportation Authority (OCTA) service area, it is not clear how the 534, which goes to Malibu, is considered outside of Metro's L.A. County service area.
These four additional lines would be eliminated (total 35,000 service hours):
- Ramona Blvd - 190 (San Gabriel Valley to Pomona) [RPI 0.61 - 110th]
- Valley Blvd - 194 (San Gabriel Valley to Pomona) [RPI 0.61 - 110th]
- Wilmington Avenue, Vermont Avenue, Western Avenue - 205 (South L.A. to San Pedro) [RPI 0.71 - 91st]
- Peck Road, Workman Mill Road, Santa Fe Springs Avenue - 270 (East San Gabriel Valley) [RPI 0.81 - 71st]
The Metro summary only specified those six to-be-eliminated lines listed above (190,194, 205, 270, 460, and 534) which combine for only 61,000 hours (16 percent of the above-mentioned 388,000 hours needed for new service.) There's the additional 40,000 hours from increasing the load factor, added to Metro eliminating 140,000 hours worth of additional unspecified "low performing lines." There's no documentation of what those lines to would be, except that "lines with a [Route Performance] index of 0.6 or below are subject to remedial action." The Metro document lists 38 lines that might or might not be cut.
![List of possible bus lines that Metro may cut in its service reorganization. Image via Metro [PDF]](https://lede-admin.la.streetsblog.org/wp-content/uploads/sites/50/2015/07/Metrocutslist.png?w=710)
Metro's document also maps some of these lines.
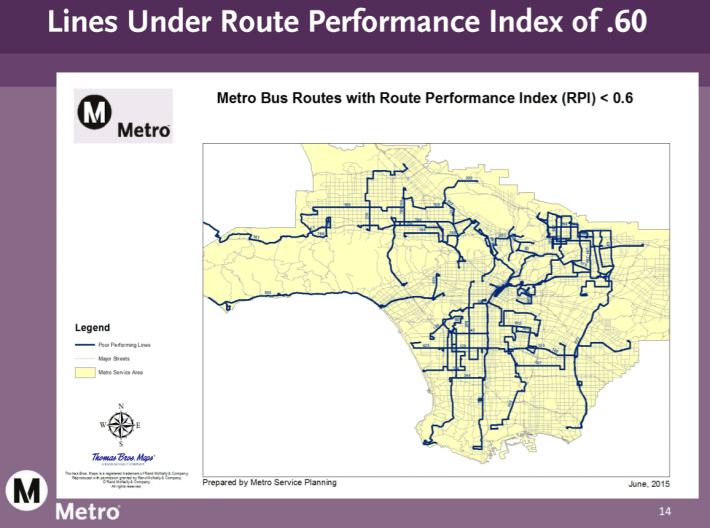
In addition to the Metro bus cuts somewhat specified, there some unspecified additional savings mentioned to be gained by Metro canceling bus routes that would be run by Municipal Operators, such as Foothill Transit or Long Beach Transit.
At its conclusion, though, the Metro document admits that, even with lots of unspecified cuts, the agency is 147,000 service hours (nearly 40 percent) short of the 388,000 needed. As Calwatch mentions, this 40 percent shortfall could be made up by something other than service cuts, possibly fare increases or a Measure R2 transportation sales tax.
Opinion and Analysis
Here's where the article shifts from neutral third person, to opinionated first person. I don't claim to be a bus network expert, but I have been riding Metro buses more than a few times a week since the early 1990s. When I see load factor mentioned, I think back to sometimes being late for work when heavily-overcrowded Vermont Avenue buses would pass up my bus stop.
Conceptually, the plan makes a lot of sense to me. I live within L.A.'s urban core, in Koreatown, and the bus lines that I ride run so frequently that I don't need to use a schedule. I just know that, for most of the day, I can go to a bus stop and a bus will show up soon. This plan won't really change those buses in my neighborhood; they're already frequent. The plan will cut some service in more peripheral areas, in order to add service to grow the area served by the central frequent network that works pretty well.
Someone who really is a bus network expert, and whom I read and trust, Jarrett Walker, praises the Metro plan. His entire piece is worth reading, but two brief take-aways. Overall, this kind of reorganization means that Metro can "serve more people without more money." And, specifically with allowing peak hour buses to be a bit more crowded, Walker writes that "saving a little peak service unlocks a lot of all-day service."
Another excellent source, Eric Jaffe at CityLab, also praises Metro's plan. Jaffe largely echoes Walker, stating that the plan "reduces car reliance, promotes equitable mobility, and ultimately increases transit ridership." Jaffe mentions similar worthwhile bus service re-vamps in Houston and Omaha.
At KCET, D.J. Waldie gives a somewhat-mixed review. He's skeptical about eliminating stops. Waldie concludes showing the bus rider's distrust of the agency: even if the plan works, it is "a given that Metro will continue to reconfigure bus operations to reduce operating expenses." Calwatch points out that, with traffic growth and Metro bus service hours kept flat, the plan is, in effect, a 3 percent cut in vehicle service miles annually.
What makes me uneasy is that I'd like to see the details. Right now, the only document [PDF] that Metro is making public shows all of the new service benefits fairly clearly, but gives a vague outline for only about two-thirds of the cuts. I am sure there are wads of consultant reports, maps, lists, data, etc. that back up Metro's plan, but the public can't actually peruse them. I expect that it's all a moving target, swayed by politics and finances, but I would be a lot more inclined to trust it if I could actually see what the snapshot looked like today. And, if Metro were more open about the plan, perhaps data-driven decisions might outweigh politics-driven ones.
Unfortunately, the little that Metro is sharing has quite a few inconsistencies:
- A handful of lines appear on both lists/maps for to-be-eliminated and to-be-improved service. Lines 190, 194, 788, and others appear in both places. Will these be more frequent or eliminated? When I asked Metro spokesperson Joseph Lemon about these inconsistencies, the response I got was that "If it is not cancelled, its service levels would be improved." Lines 190 and 194 may be operated by Foothill Transit in the future.
- Though Metro has a stated formula for its Route Performance Index, the RPI spread sheet they released does not include their formula. When I try to use Metro's data and Metro's formula to validate their RPI list, I can't get my calculated number to match theirs.
- The Metro RPI spreadsheet does not match the RPIs mentioned in the plan [PDF p.13]. For example, for line 788 the spreadsheet has 0.81 while the plan states 0.58.
If Metro expects to build trust around major data-driven changes, the agency should be transparent about both the changes and the data.
I'd like to be able to praise Metro's plan, but I am reserving judgement for when an actual plan is made available for review. It may well be a step in the right direction, depending on what it ultimately is.

