First Metro Countywide Sustainability Annual Report, With Plenty Of Graphs
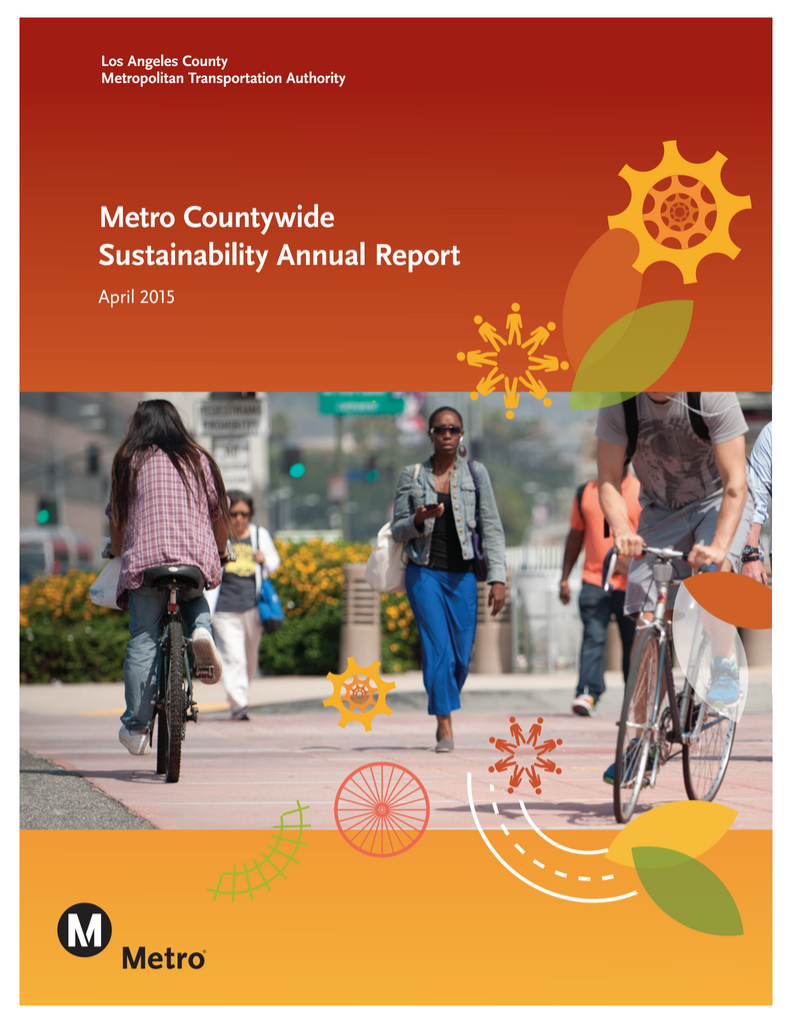
At yesterday’s Metro Board of Directors Ad Hoc Sustainability Committee meeting, Metro staff shared the agency’s first Metro Countywide Sustainability Annual Report [PDF]. The report establishes a baseline to “track sustainability progress going forward for Metro’s own actions and broader measures of sustainability throughout the county. The Countywide Performance Metrics measure sustainability outcomes countywide such as how people travel throughout the county, the environmental impacts of this travel and how transportation and land use shift over time.”
The report includes brief case studies on sustainability projects from vanpools, to greenways, to bike hubs. It includes a spreadsheet with Metro’s status on its identified sustainability work plan.
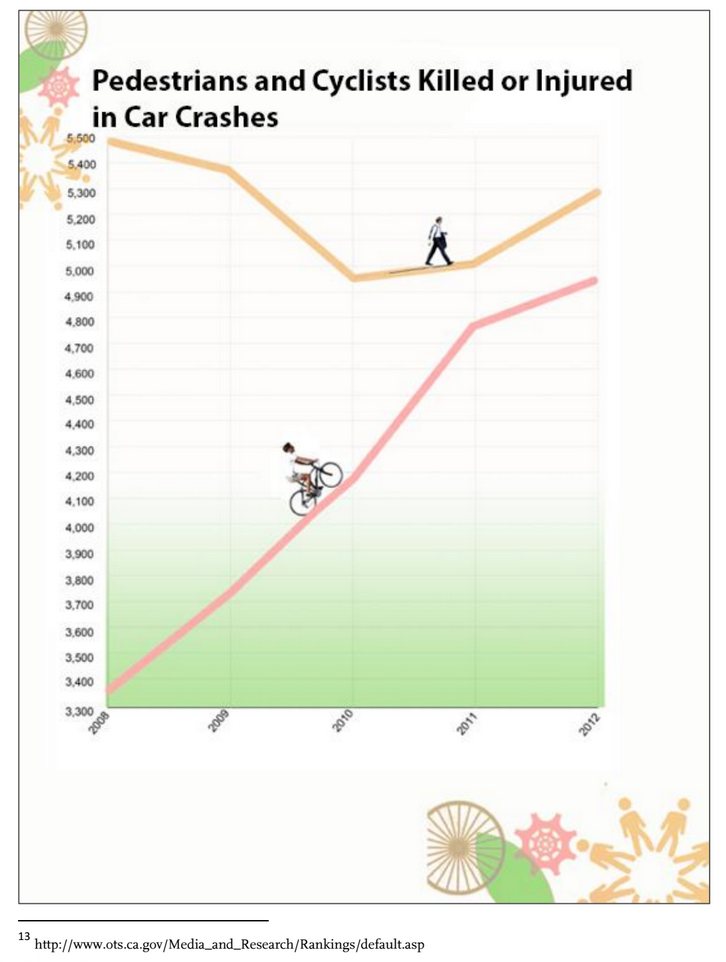
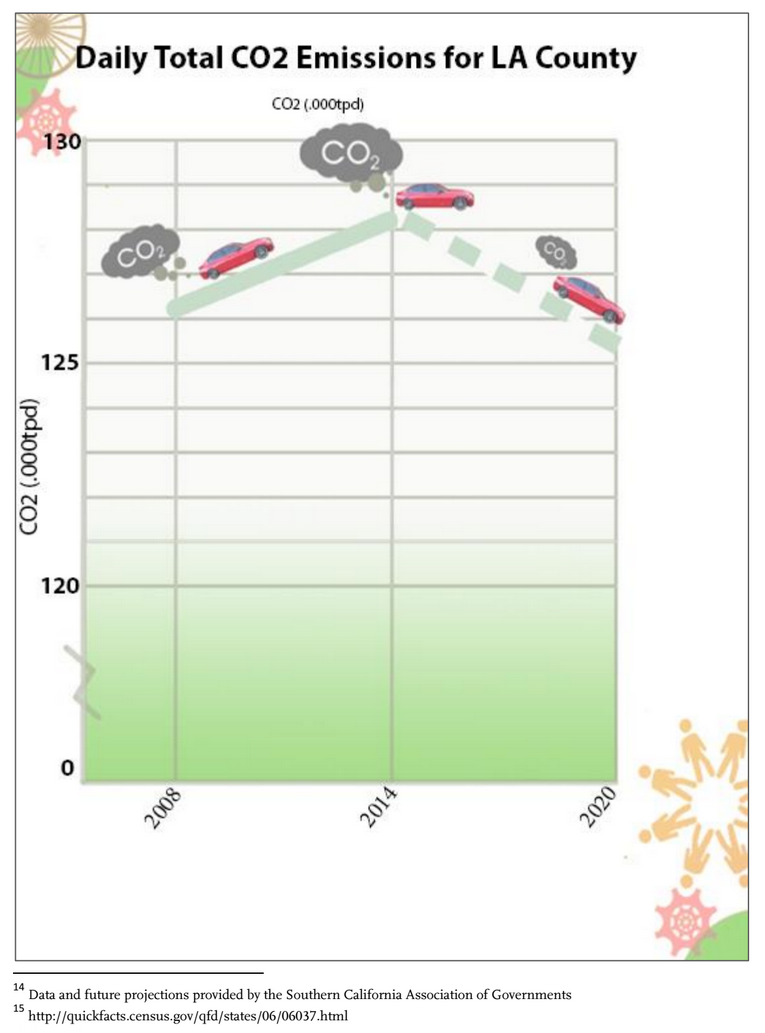
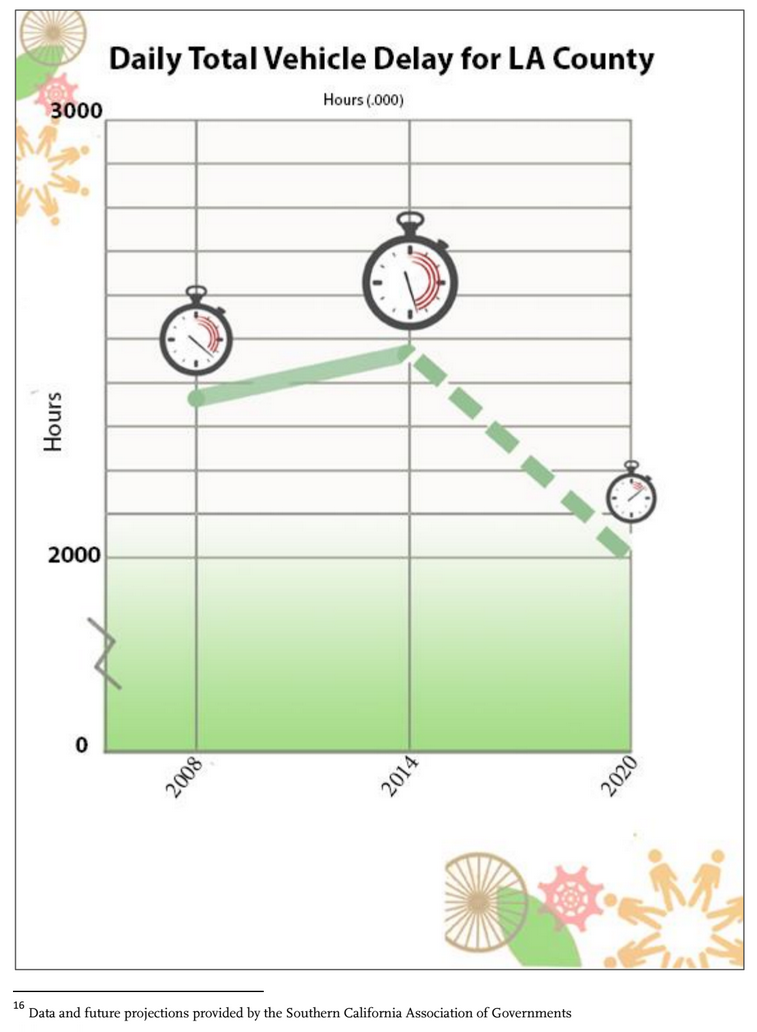
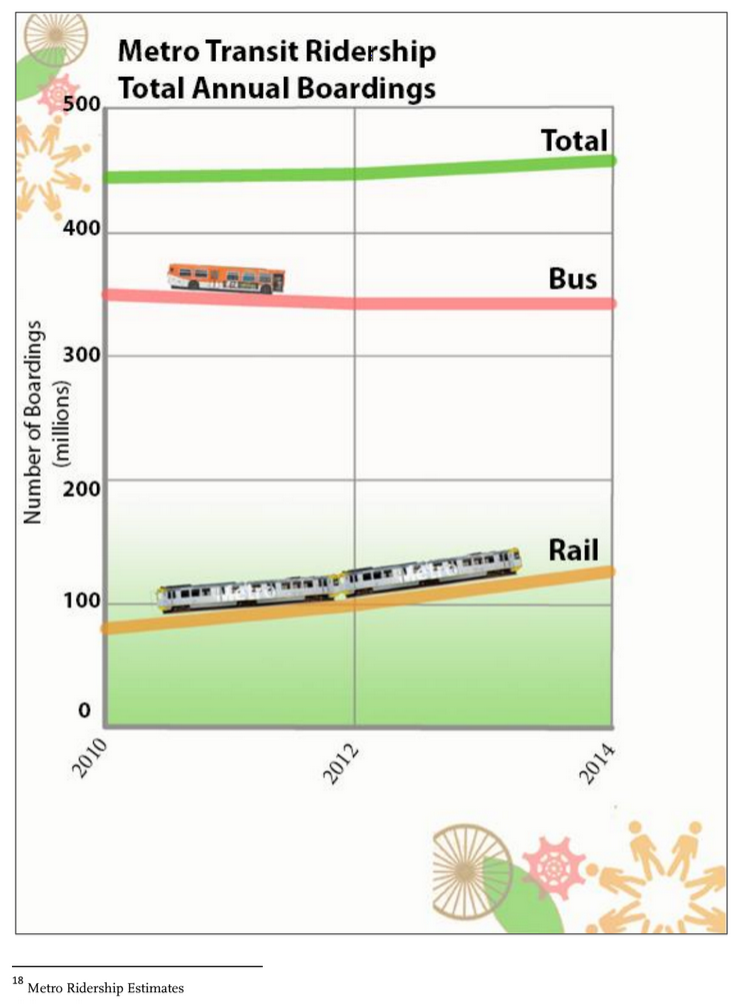
The bulk of the report is a series of graphs showing Countywide Performance Metrics, including Vehicle Miles Traveled, Total Person Trips for Carpool and Active Transportation, Daily Total CO2 Emissions for L.A. County, Metro Transit Ridership Total Annual Boardings, and more. Each of these metrics are shown on graphs, most of which SBLA has included below in the order in which they appear in the report.
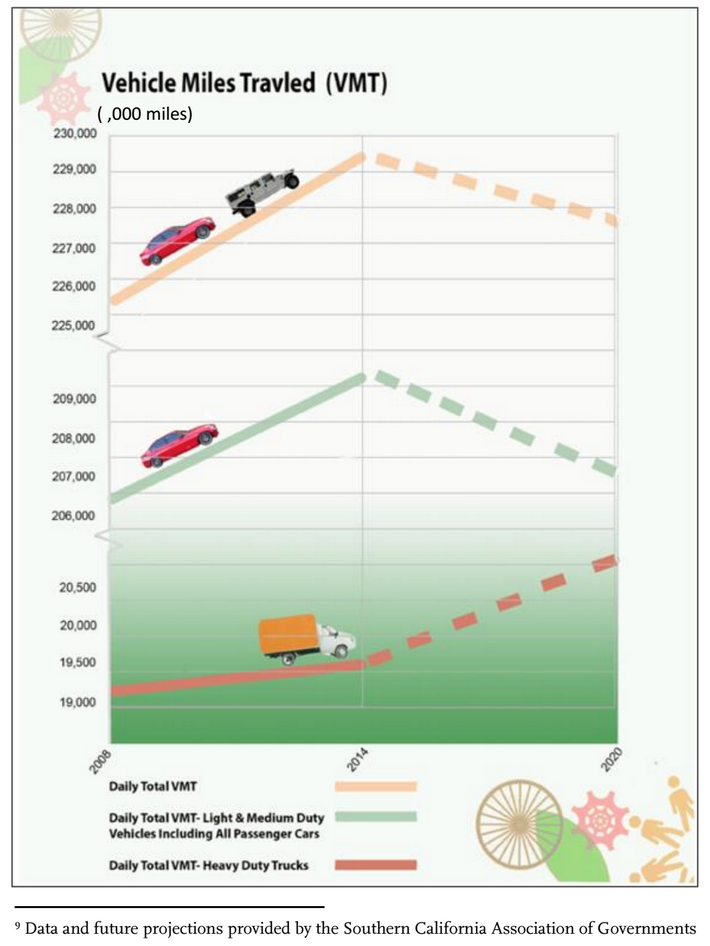
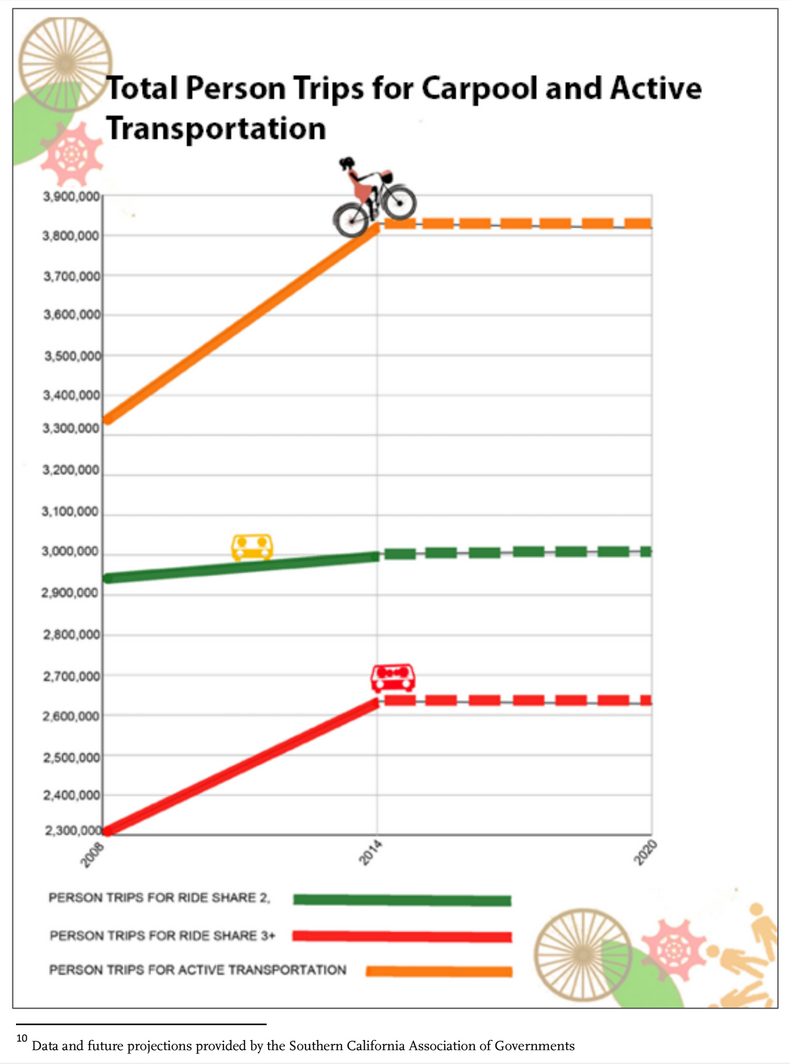
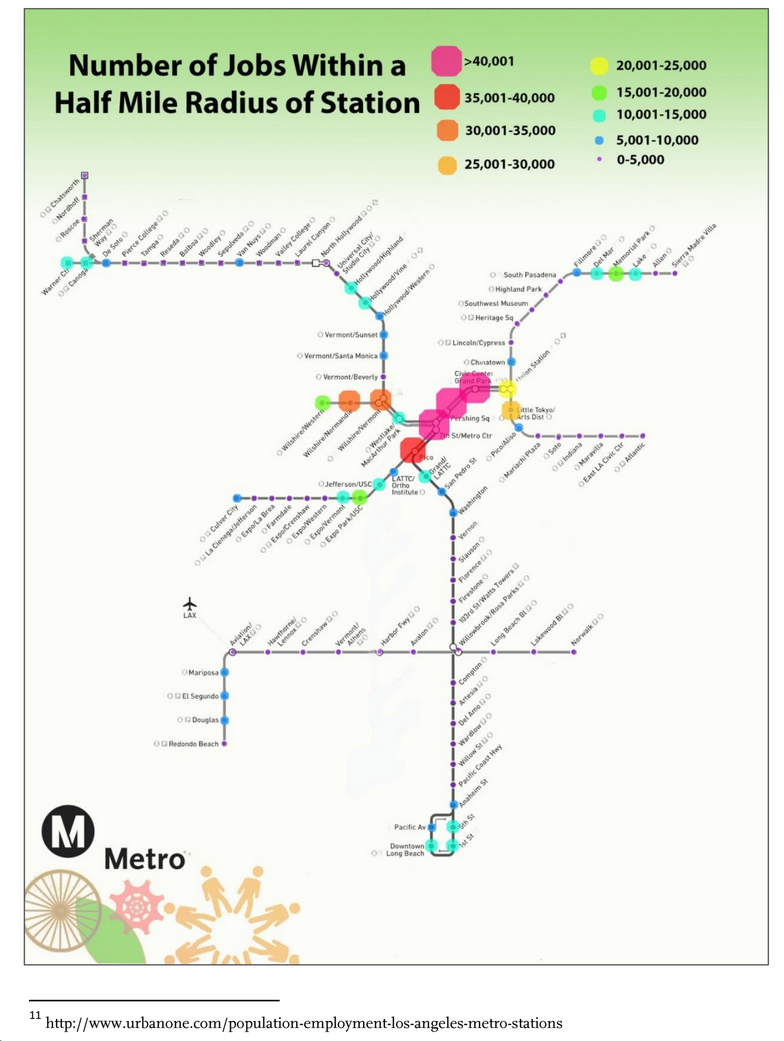
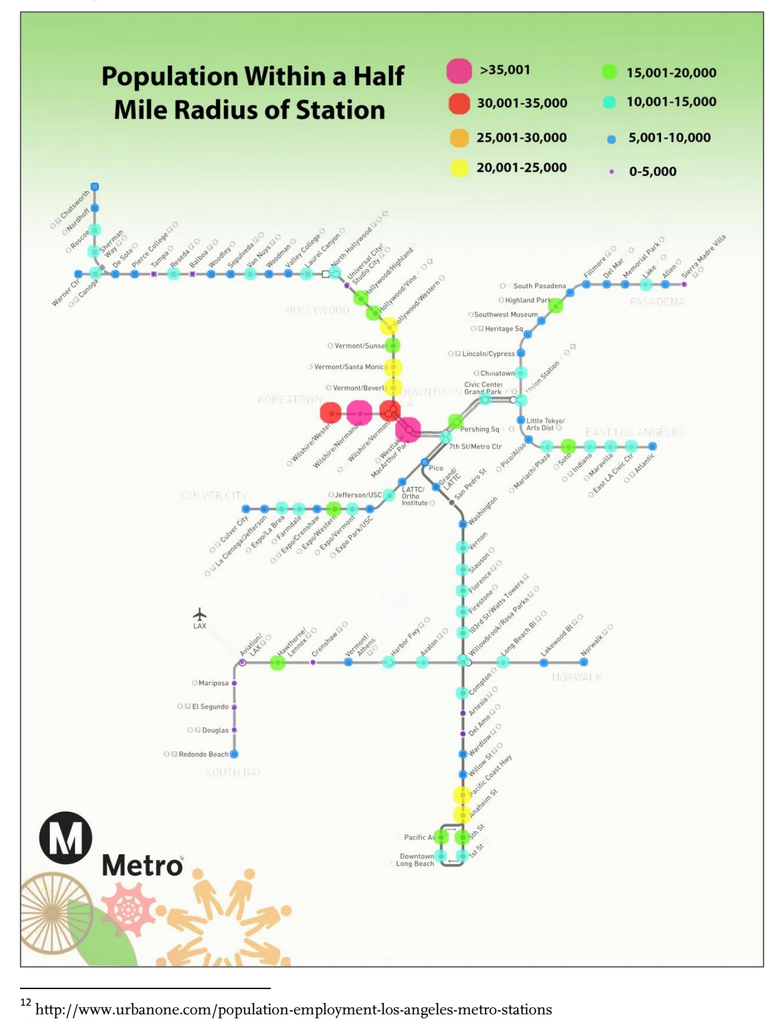
SBLA will mostly leave these graphs to speak for themselves, as it is welcome to see Metro publicly establishing sustainability baselines which it will track and report on annually.
Predictions (most of which here are from the Southern California Association of Governments – SCAG, not Metro), especially ones about the future and about 21st century transportation, are pretty difficult.
Examples of metrics that could benefit from refinement would be bicycle and pedestrian injuries and deaths. It can be somewhat misleading to show just the absolute number of injuries and deaths, without taking into account how many people are utilizing a mode. If, for example, bicycle trips triple and bicycle deaths double, then the number of deaths per trip is actually declining even though the overall number of deaths is increasing. Similarly, other absolute numbers including transit ridership and VMT, could also be reported as modal share percentage and per-capita respectively.
And, of course, it would be helpful to not just publish these statistics as PDF graphs, but also include actual data in an open easily-shared format that researchers and the public can access and study.

Streetsblog has migrated to a new comment system. New commenters can register directly in the comments section of any article. Returning commenters: your previous comments and display name have been preserved, but you'll need to reclaim your account by clicking "Forgot your password?" on the sign-in form, entering your email, and following the verification link to set a new password — this is required because passwords could not be carried over during the migration. For questions, contact tips@streetsblog.org.