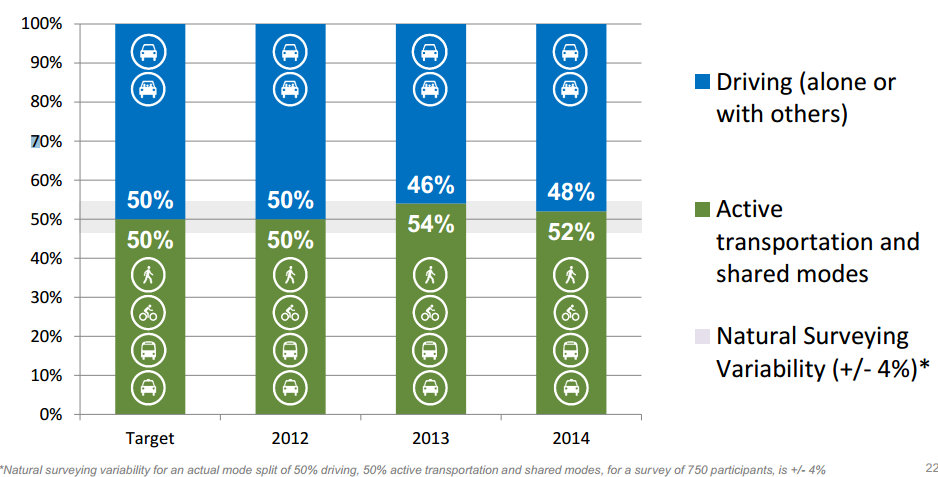
Last week, the Los Angeles Times published an article titled, "San Francisco residents relying less on private automobiles." It is summarized at today's Metro transportation headlines. The Times highlighted recent good news, reported in early February at Streetsblog SF, that 52 percent of San Francisco trips are taken by means other than a private car: walk, bike, transit, taxi, etc. The data are from a San Francisco Municipal Transportation Agency (SFMTA) survey examining all trips, not just commuting. The time frame is from 2012 through 2014.
First, let's celebrate! This is great news. In California's second-largest city one of California's largest cities, sustainable healthy transportation holds a majority.
The Times briefly mentions similarities between S.F. and L.A. in terms of transit investment, but mostly frames the good news by drawing sharp distinctions between L.A. and S.F. The Times article states:
- "In stark contrast to car-dependent Los Angeles, studies show that most trips in the burgeoning tech metropolis [S.F.] are now made by modes of transportation other than the private automobile."
- "At 47 square miles, San Francisco is relatively small and densely populated. There are more than 17,000 residents per square mile — twice that of Los Angeles [City]."
- "Los Angeles has an entrenched car culture and the city alone is spread out over nearly 10 times the area of San Francisco. Its population density of 8,100 people per square mile is less than half that of the Bay Area city."
- "Countywide, the [L.A. County] land area is an enormous 4,752 square miles, and the density drops to about 2,100 people per square mile."
Just how stark is this contrast between Los Angeles and San Francisco?
The way I see it, the Times isn't really comparing apples to apples. The Times compares these three entities: (2013 U.S. Census data)
- S.F. City/County (47 square miles - 837,000 residents - ~17,800 people/square mile)
- L.A. City (470 square miles - 3,880,000 residents - ~8,250 people/square mile)
- L.A. County (4,752 square miles - 10,020,000 people - ~2,110 people/square mile)
Just based on area, how meaningful is comparing one county with another that's over one hundred times larger? Or one city with another that is ten times larger?
What is more instructive is to compare two areas that have the same population, or two populations that are the same size and see how the areas they occupy differ. Here are a few recent L.A. vs. S.F. comparisons that examine areas that are roughly the same size, then look at how populations and transportation choices are similar or different. (Is anyone out there aware of studies that compare larger areas, such as 5,000 square miles of Bay Area vs. 5,000 square miles of L.A. County? One recent study ranked the L.A. area just a little less sprawling than the S.F. area.)
First, a comparison study by former Streetsblog S.F. writer Michael Rhodes, currently a transportation planner with the firm NelsonNygaard .
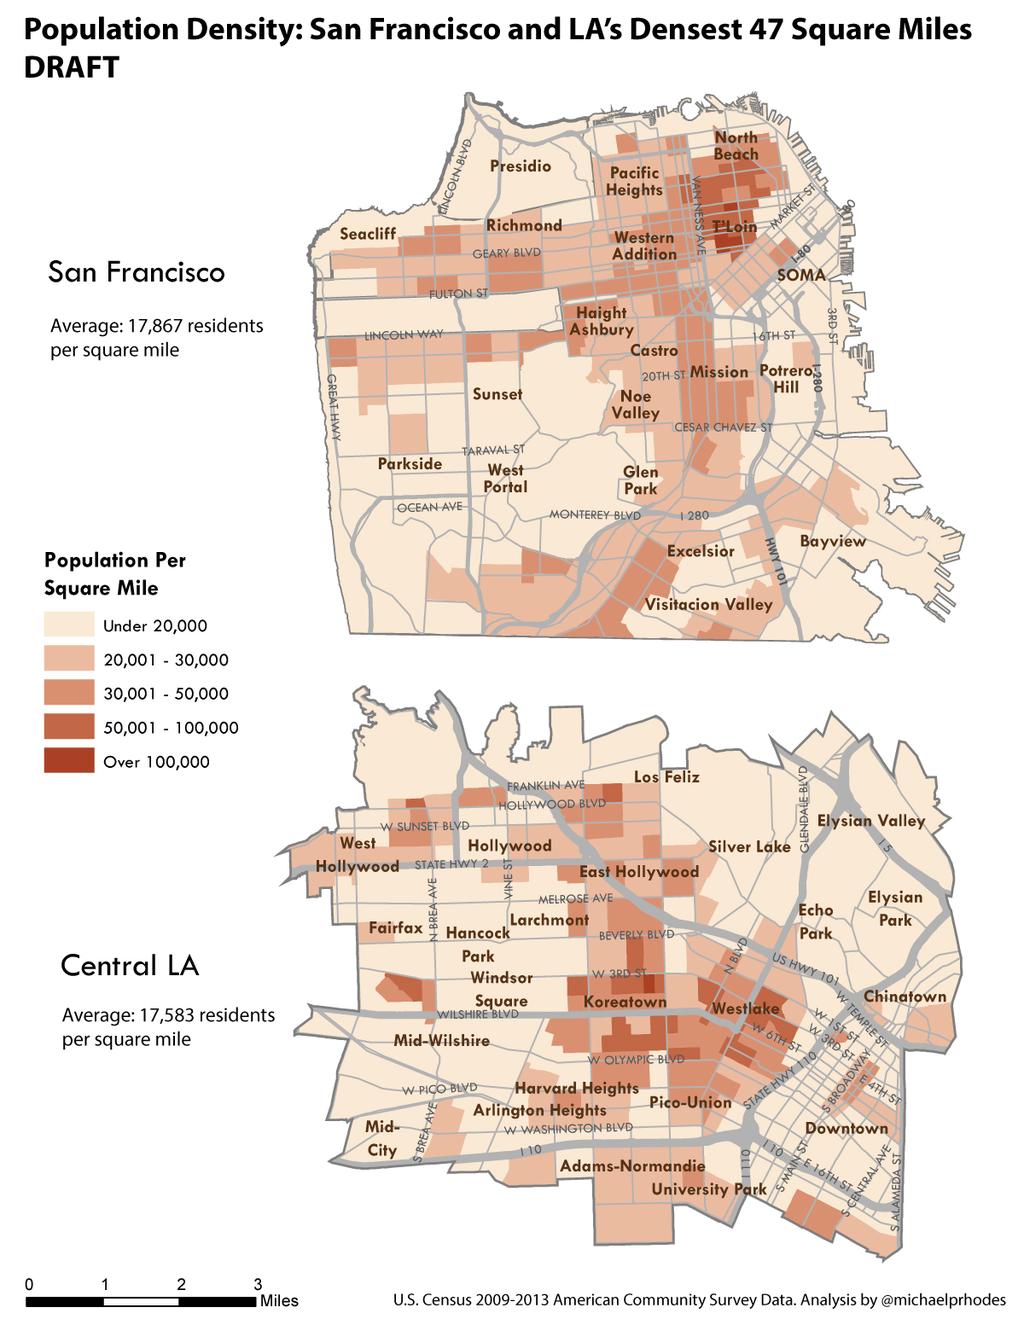
Rhodes mapped out the 47-square-mile city/county of San Francisco and the corresponding densest 47-square-mile area of Los Angeles County. L.A.'s densest area centers in Koreatown, extending to Downtown, Hollywood, West Hollywood, and USC. The population densities are more similar than different: S.F. averages 17,867 residents per square mile, while central L.A. averages 17,583. The dramatic difference in population density cited by the Times--"[S.F. City density] twice that of Los Angeles [City]"--shrinks to only a two percent difference.
Rhodes also mapped levels of bicycle commuting in San Francisco and in the corresponding areas of central L.A.
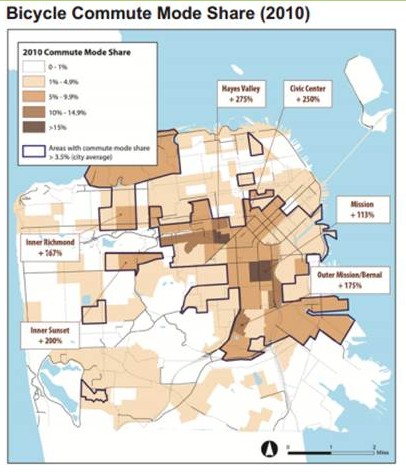
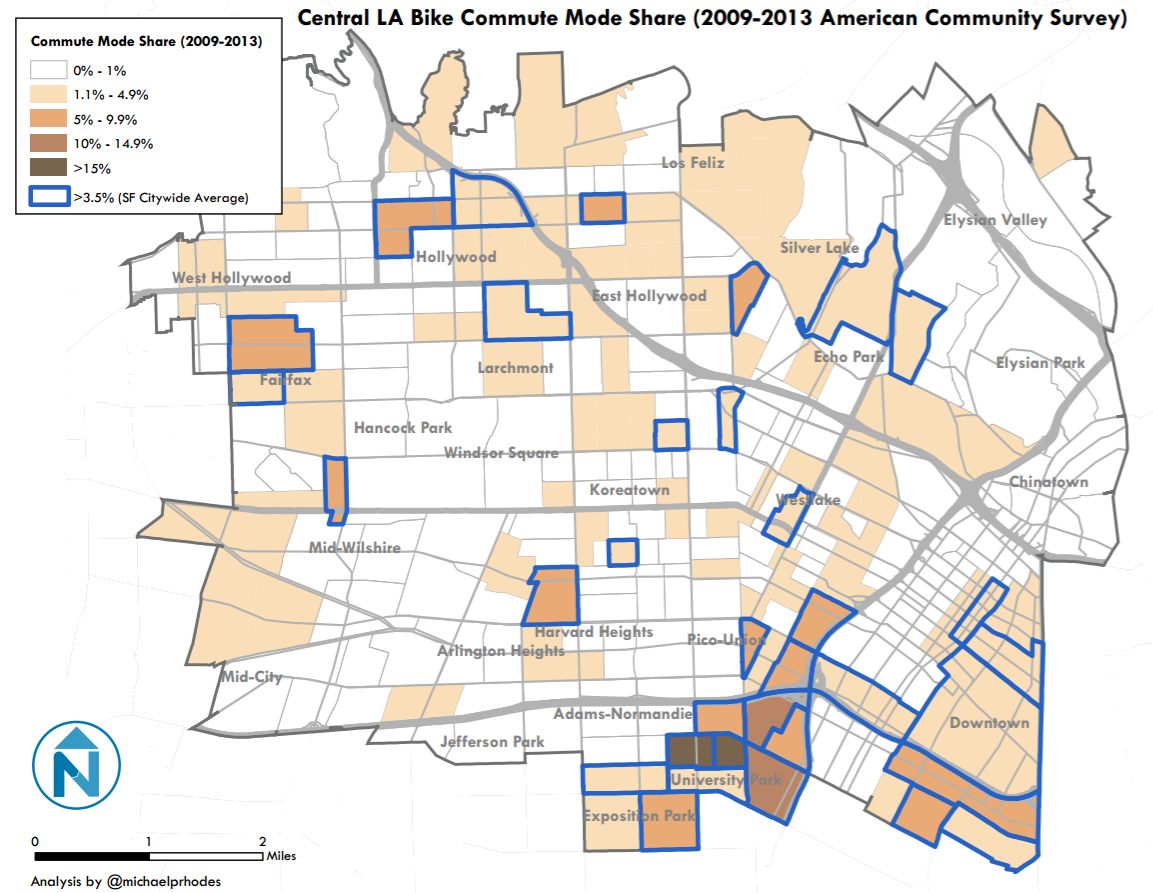
Rhodes did not write any overall comparison characterizing these two maps. The way I read it, in around half of the area of both S.F. and Central L.A., bicycle commuting is close to nil (less than one percent of residents) S.F. appears to have a denser, more focused central area where bicycling is concentrated and exceeds L.A. overall, but significant parts of Central L.A. -- especially Downtown to USC -- are analogous to and even exceed the more heavily-bicycled parts of S.F. The USC area sees the highest rates of cycling in L.A. County, which helps L.A.'s numbers.
There are a bunch of caveats that apply here. The U.S. Census data only counts commute trips, which ignores many short trips. Walking to the corner or bicycling to school or the park are not counted. Some of this rolling Census data dates to 2009, two years before L.A. approved its bike plan and stepped up implementation of bike lanes, especially Downtown. Recent data show increasing levels of bicycling statewide and locally. And, as my colleague Sahra Sulaiman pointed out, many of these of central L.A. neighborhoods are heavily populated by lower income immigrants (more so than the corresponding S.F.), hence it is more difficult to study. These are the folks you are least likely to get data from because they don't answer surveys. It is likely that central L.A. population density, and levels of walking, transit, and bicycling, may be under-counted.
(Rhodes is currently doing some S.F./L.A. comparisons of job centers, too, which we'll cover in a later article.)
Los Angeles planner and cycling advocate Jeff Jacobberger examined a similar Central Los Angeles area, though with slightly different boundaries.
Jacobberger communicated to SBLA:
The Census Bureau divides the City into Public Use Microdata Areas, or PUMAs. I’ve attached a map that shows the boundaries of 5 PUMAs that make up Central and East L.A. The boundaries are roughly the base of the Hollywood Hills to the north, the L.A. River and Boyle Heights/East L.A. to the east, roughly the 10 Freeway to the south, and Robertson/La Cienega/La Brea to the west (excluding Beverly Hills, West Hollywood, and the part of L.A. north of the City of West Hollywood).
Jacobberger's map:

According to Jacobberger, these five PUMAs comprise a central Los Angeles area that is roughly 53 square miles (slightly larger than S.F.'s 47 square miles), with 850,000 residents, hence a density of roughly 16,000 people per square mile. This places S.F.'s population density (17,800) only ten percent greater than central Los Angeles. Much closer than the Times' "double."
Jacobberger compared commute mode share from the 2012 U.S. Census American Community Survey for this 53-square mile area of Los Angeles to the overall city of Los Angeles and to the combined city/county of San Francisco.
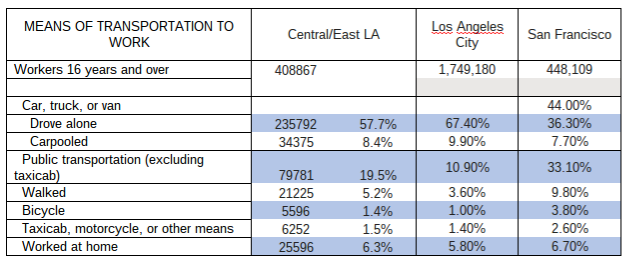
In Jacobberger's analysis, S.F. still beats central L.A. for levels of transit, bicycling, and walking, but the Times' "stark contrast" is diminished. Central Los Angeles commuting resembles S.F. more than it does the rest of the city of Los Angeles.
- Transit: S.F. 33.1 percent, central L.A. 19.5 percent, L.A. City 10.9 percent
- Walking: S.F. 9.8 percent, central L.A. 5.2 percent, L.A. City 3.6 percent
- Bicycling: S.F. 3.8 percent, central L.A. 1.4 percent, L.A. City 1.0 percent
- Driving Alone: S.F. 36.3 percent, central L.A. 57.7 percent, L.A. City 67.4 percent
Similar to the information above, the data are limited to commuting, a few years old, and likely to under-count low-income immigrant communities. Jacobberger found slightly lower levels of density and bicycling than Rhodes, because his overall boundary was slightly different, and did not include the USC area.
The Times' sweeping generalizations about how all of L.A. County travels are misleading. Central L.A. and all of S.F. are somewhat similar, in terms of population density and transportation. Depending on where the lines are drawn, San Francisco appears just slightly more population-dense and has somewhat higher levels of transit ridership, walking, and bicycling.
In terms of jurisdictions, though, the differences are pretty stark. The Times sort of spotted this, but chose to contrast transportation instead of contrasting politics.
San Francisco is, in a way, fortunate that its city and county boundaries coincide, and represent a somewhat coherent whole. Los Angeles County and City have very broad political boundaries, and are hence much less cohesive areas than San Francisco. That central 50-square-mile chunk of Los Angeles is governed by a mayor who needs the votes of a majority of those who reside in the other 90 percent of L.A.'s land. In many ways, L.A.'s large area (both city and county) means that the fate of Central L.A. is politically more tied to L.A.'s less urbanized areas, at least in comparison to S.F.
This jurisdictional breadth impacts Los Angeles' urbanity. One-size-fits-all regulations do not fit Los Angeles so well. For example, parking needs are very different for suburban Chatsworth and urban Koreatown, although both are part of the city of Los Angeles.
At the recent Live Ride Share conference, SFMTA Director of Strategic Planning and Policy Tim Papandreou's presentation included Rhodes' maps. Papandreou remarked that San Francisco's transportation policies, facilities, and behavior had, until a few years ago, been more-or-less similar to that of central Los Angeles. In his presentation, Papandreou emphasized that recently S.F. has prioritized active transportation and transit, and has seen increases in those trip percentages.
As Papandreou puts it in an email to SBLA: (updated March 3, 2:15 pm)
The city of S.F./Central L.A. City areas are roughly similar in population density.
The mode share of S.F. 6 years ago and Central L.A. today are roughly similar, but now it’s 50/50 in S.F. That’s in part due to the street network changes, parking management, and transit service upgrades leveraging the land use developments and the influx of workers. L.A. is going through all these changes now, so it will be interesting to see how this changes mode share over time.
Can the city and county of Los Angeles set aside our Times-echoed misconceptions and let central Los Angeles livability flourish? Could this spill over and foster walkability and livability at multiple centers throughout the L.A. area? We'll see.