(Update, July 7: Jane Choi from the Planning Department called me to inform me that the "40 miles per year" goal didn't start until July 1, 2011, the start of the fiscal year. While it seems an odd date to start an implementation plan for the 2010 Bike Plan, it is the start of the first fiscal year after the Mayor promised cyclists "40 miles per year." Regardless, this means the clock is ticking. L.A., you have 358 days to provide 40 new miles of bike facilities. - DN)
The city of Los Angeles' "2010" bike plan was approved March 1st 2011. The overdue passage received praise from the media, who called it "comprehensive", "historic" and "[if built, marks] one of the most lasting achievements of Mayor Antonio Villaraigosa's tenure." The bike plan won an award from the Los Angeles section of the American Planning Association.
Mayor Villaraigosa and others have touted the plan's 1600 miles of bikeways, and pledged to implement 40 miles each year. Last week, the mayor released a July 1st 2011 Executive Directive on Implementation of the 2010 Bike Plan. The directive reiterates the 40 miles/year commitment, and commits other city departments to include bikes in various city projects.
With the new directive, and the start of a new fiscal year, Streetsblog takes a look at how the "2010" plan implementation is going so far. Streetsblog readers will recall that the city bike plan includes a "5-year" implementation plan. As noted in the initial Streetsblog review of the implementation plan, the "5-year" plan, based on planned completion dates is actually an 8-9 implementation plan. The implementation plan online includes dates - ie: includes "Year 0" for "Project Year 2010", through "Year 5" for "Project Year 2015." Though in the final council file version, the dates have been scrubbed and replaced by priority 1 through 3, with no dates specified.
Given that it's now July 2011, the "2010" bike plan is, theoretically, a year and a half into its implementation plan timeline, which began with "project year 2010." Just how many miles of bike lane is the city of Los Angeles implementing? Are L.A. cyclists seeing that "commitment to build 40 miles of bikeway a year" in themayor's directive? How does recent implementation compare to past performance?
While, overall, the city has been exceeding its past (lackluster) performance, it appears that the 40 miles annually remains elusive.
From 1996 until late 2009, under the city's 1996 Bicycle Master Plan, Los Angeles implemented a total of 66.7 new miles of bike lane. Dividing the 66.7 miles by the 13 years, the city implemented an average of about 5.1 miles of bike lane each year.
In 2009, the city implemented a total of 4.09 miles of bike lane: (Bike lane projects listings below are in rough date order, with from/to limits in parenthesis.)
- La Tuna Canyon (Sunland-Elden) 2.46 miles
- Myra Avenue (Fountain-Santa Monica Blvd) 0.44 miles
- Reseda Blvd (SF Mission Road-Devonshire) 1.19 miles
In 2010, the city did significantly better, roughly triple its yearly average with15.3 miles of bike lane:
- Hoover St (98th-120th) 1.6 miles
- San Pedro St (115th-120th) 0.4 miles
- Wentworth (Sheldon-Wheatland) 2.1 miles
- Winnetka Ave (Nordhoff -Gault) 2.3 miles
- Louise Ave (Lassen-Devonshire) 0.7 miles
- Reseda Blvd (Devonshire-Parthenia) 2.0 miles
- Wilbur Ave (Nordhoff-Chattsworth) 2.0 miles
- Reseda Blvd (Valerio-Roscoe) 1.1 miles
- Rinaldi St (Mason-Tampa) 1.3 miles
- WoodleyAve (Sherman-Saticoy) 0.5 miles
- York Blvd (Eagle Rock-Ave 55) 1.3 miles
In 2010, in addition to 15.3 miles of bike lanes, the city implemented 8.3 miles of "enhanced bike routes" (sharrows) and 2.6 miles of bike paths (L.A. River), for an overall 2010 total of 26.2 new miles of bikeway.
With 2011 halfway through, the city has so far striped 5.54 miles of bike lane.
- Woodman Ave (Oxnard-Vanowen) 1.0 miles
- Fair Park Ave (Eagle Rock-Maywood) 0.20 miles
- Martin Luther King Blvd (Rodeo-Marlton) 1.04 miles
- Exposition Blvd (Harcourt-Catalina) 3.3 miles
There are additional projects anticipated in 2011. These include 7th St, Vermont Ave (in South L.A.), additional mileage on York Blvd, Reseda Blvd, and Main St (in Venice), and some others. Even if all those come through, it appears that the city is on a trajectory to fall short of 40 miles in 2011. To get 40 in 2011, the city will need to implement bike facilities about seven times more quickly in the second half of 2011 than it has done in the first half... which runs somewhat counter to the city's plan to subject many relatively straightforward projects to lengthy and costly environmental review studies.
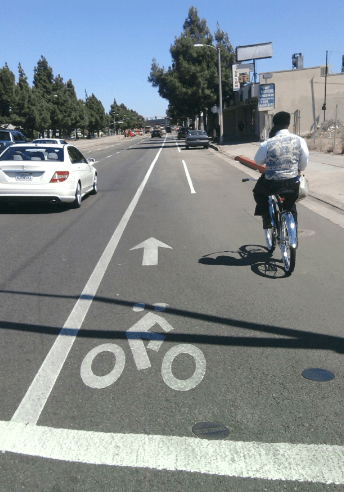
In addition to quantity, quality is important. From 2009 through mid-2011, the city has striped two-thirds of its new bike lanes (~17 miles out of ~25 miles, listed above) in the San Fernando Valley, predominantly in the northwest Valley, arguably the city's most suburban communities. Plenty of Valley folks bike, and bike lanes are welcome and needed in the Valley... but it appears that the city is not necessarily responding to increased levels of bicycling in the northwest Valley, but instead tending to implement bike lanes where there are excessively wide suburban streets that, often, accommodate bike lanes without removing any car lanes.
At the same time, the city has neglected to implement any bikeways in the urban core. The bike lane closest to Los Angeles City Hall (Hoover Street beginning at Venice Blvd) is just over 3 miles bike ride from City Hall. As has been advocated by the Los Angeles County Bicycle Coalition, new bikeways are especially needed in population-dense core communities. In these neighborhoods, where shorter trips are conducive to cycling, many families lack access to cars and large number of working-class residents depend on the bicycle as their primary mode of transportation.
Another quality issue might be widespread downgrading of bike lanes to bike routes. If the city chooses to meet its 40 mile per year commitment primarily by merely posting bike route signage, or by merely adding sharrows, not only would this demonstrate a lack of commitment to safe effective facilities, but it would be a clear attempt to undermine the bike plan. The City Council's approved implementation priorities include predominantly bike lanes, and some bike boulevards, called "bike friendly streets."
While it's good to see the city's bike facility implementation trend upward, the overall totals don't quite match city promises. If the mayor and council intend to make good on the 40 new bikeway miles per year they have pledged, it appears that the city needs to step up its bikeway implementation.
