A Peek into Metro Rail Ridership Details Station-by-Station
A poster on Reddit, misken67, has been sharing some fascinating and informative visualizations of recent Metro rail and BRT ridership data. SBLA shares misken67’s maps, graphs, and insights below, but if you’re interested in this sort of ridership detail you’ll want to go the original /LAMetro subreddit posts with maps and graphs.
Many SBLA readers are aware that overall Metro ridership has been growing steadily for the past two years, and is poised to soon fully recover from losses at the outset of the pandemic.
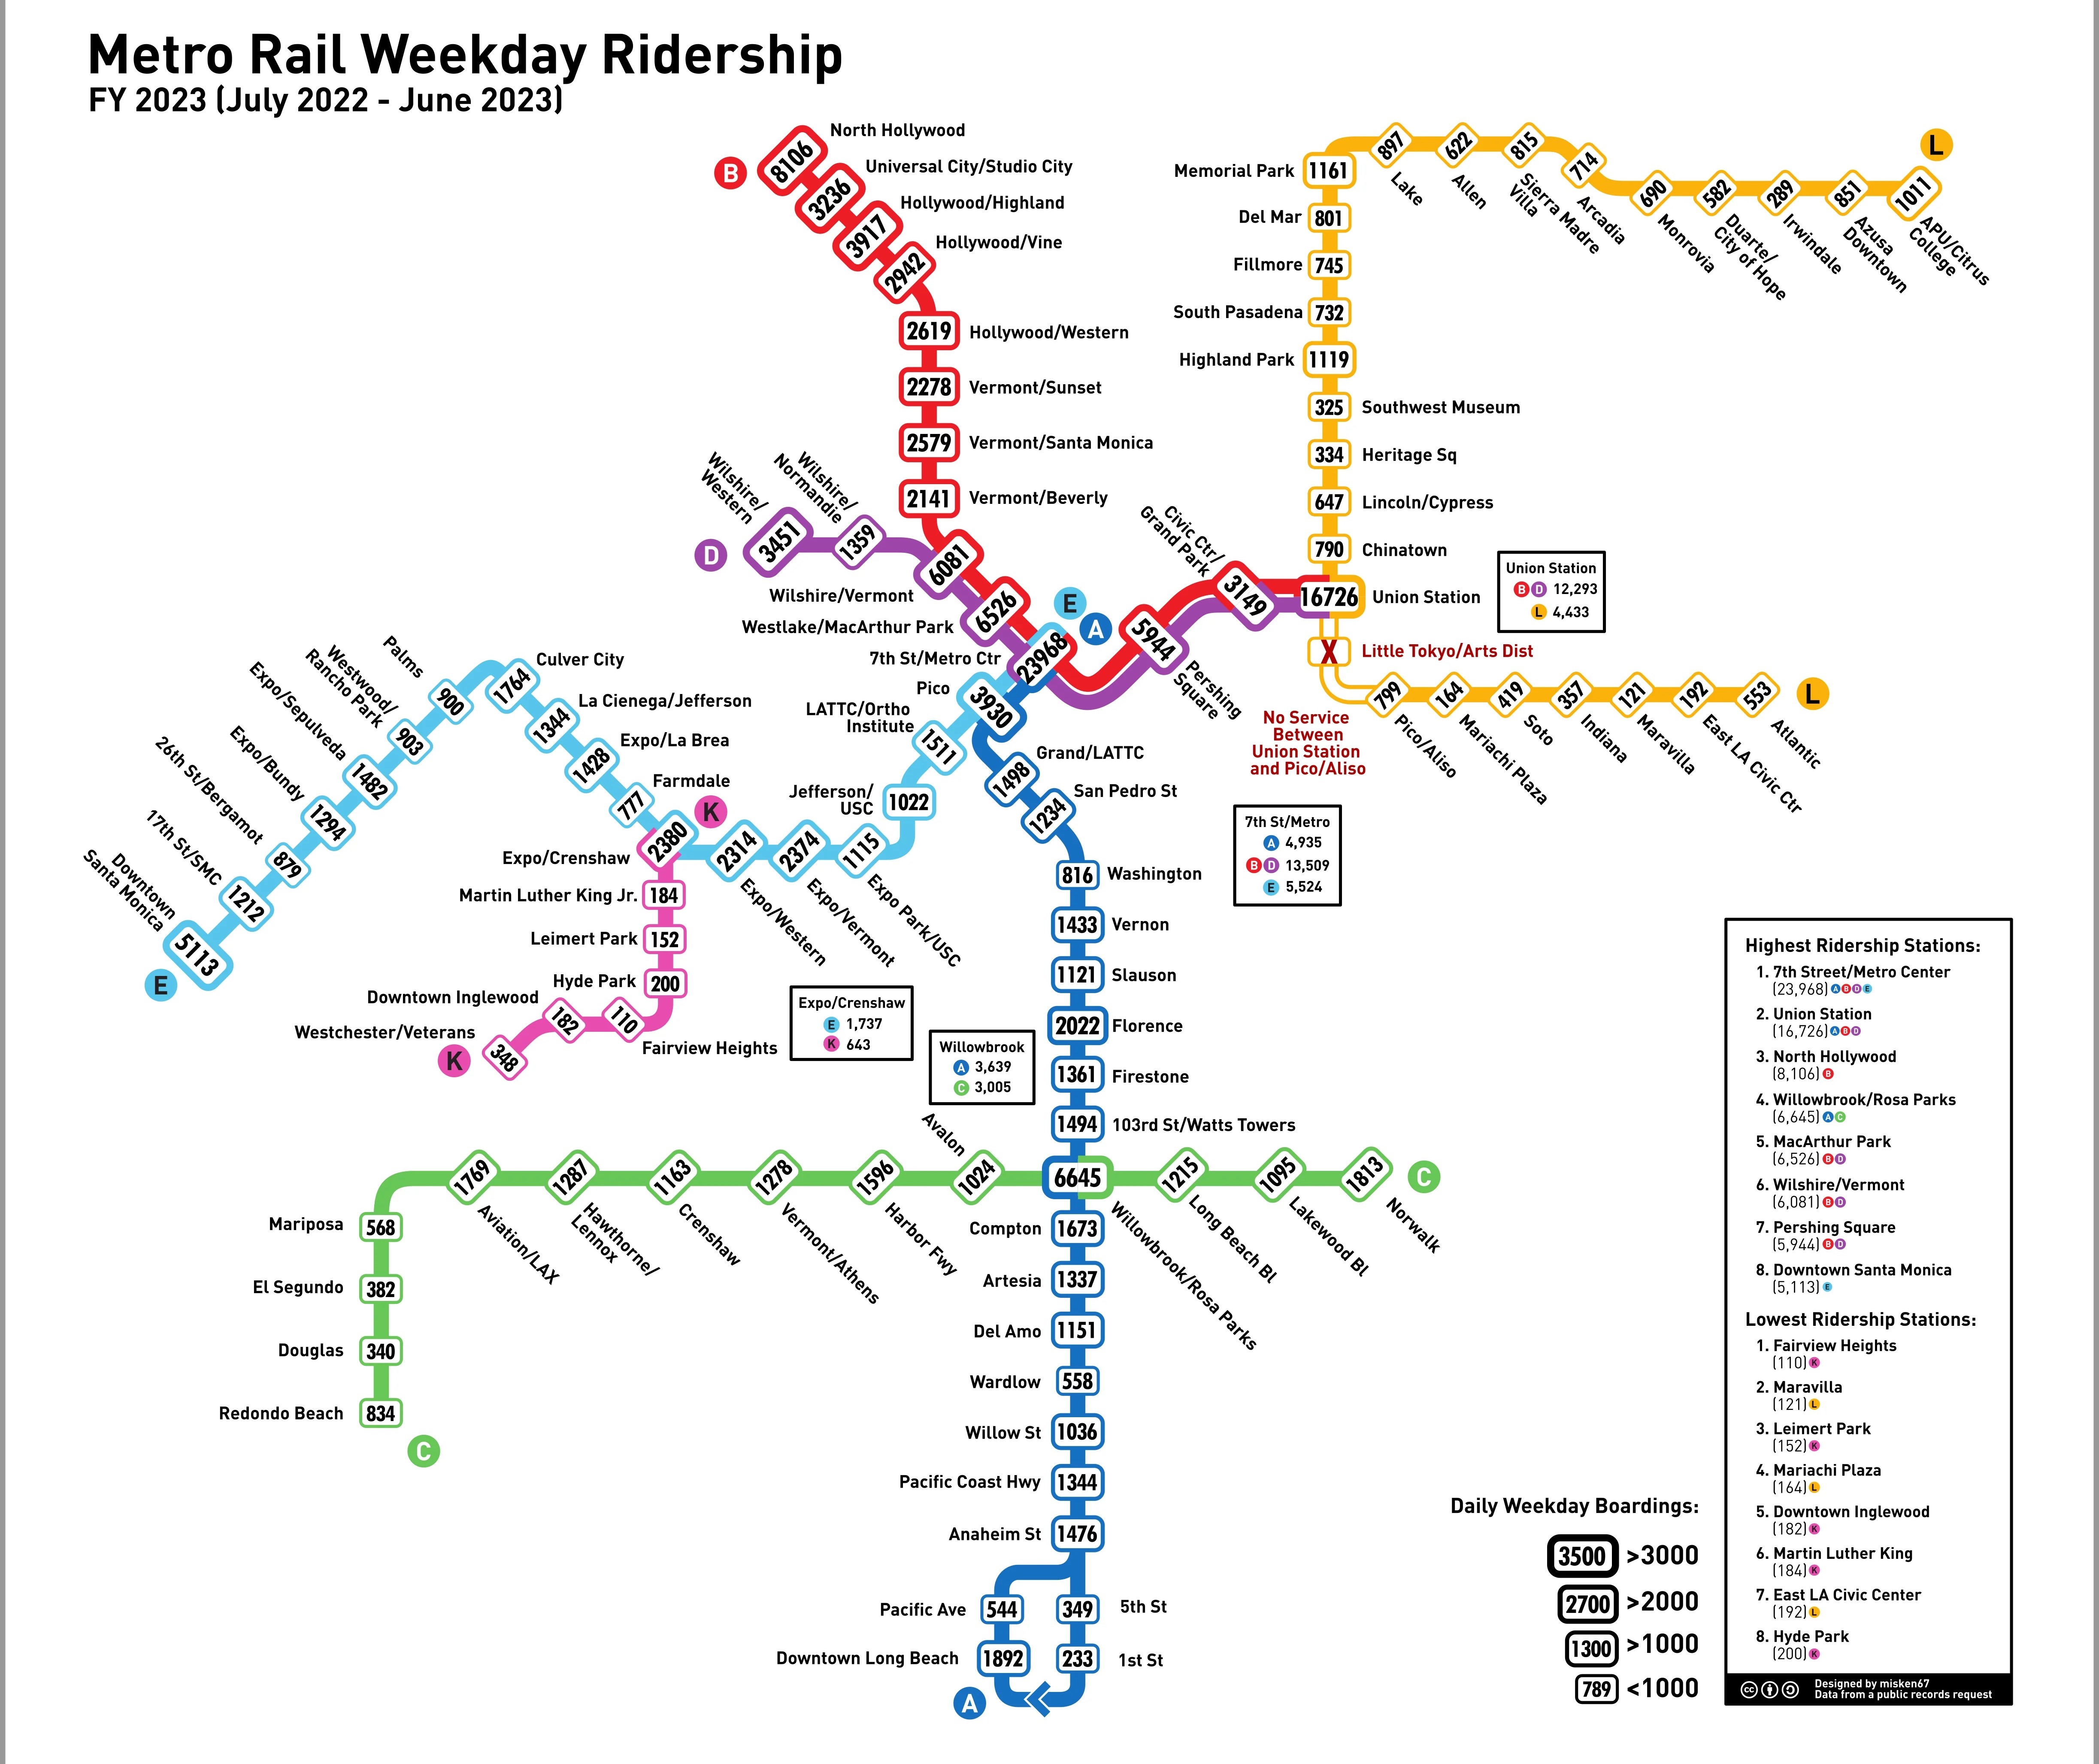
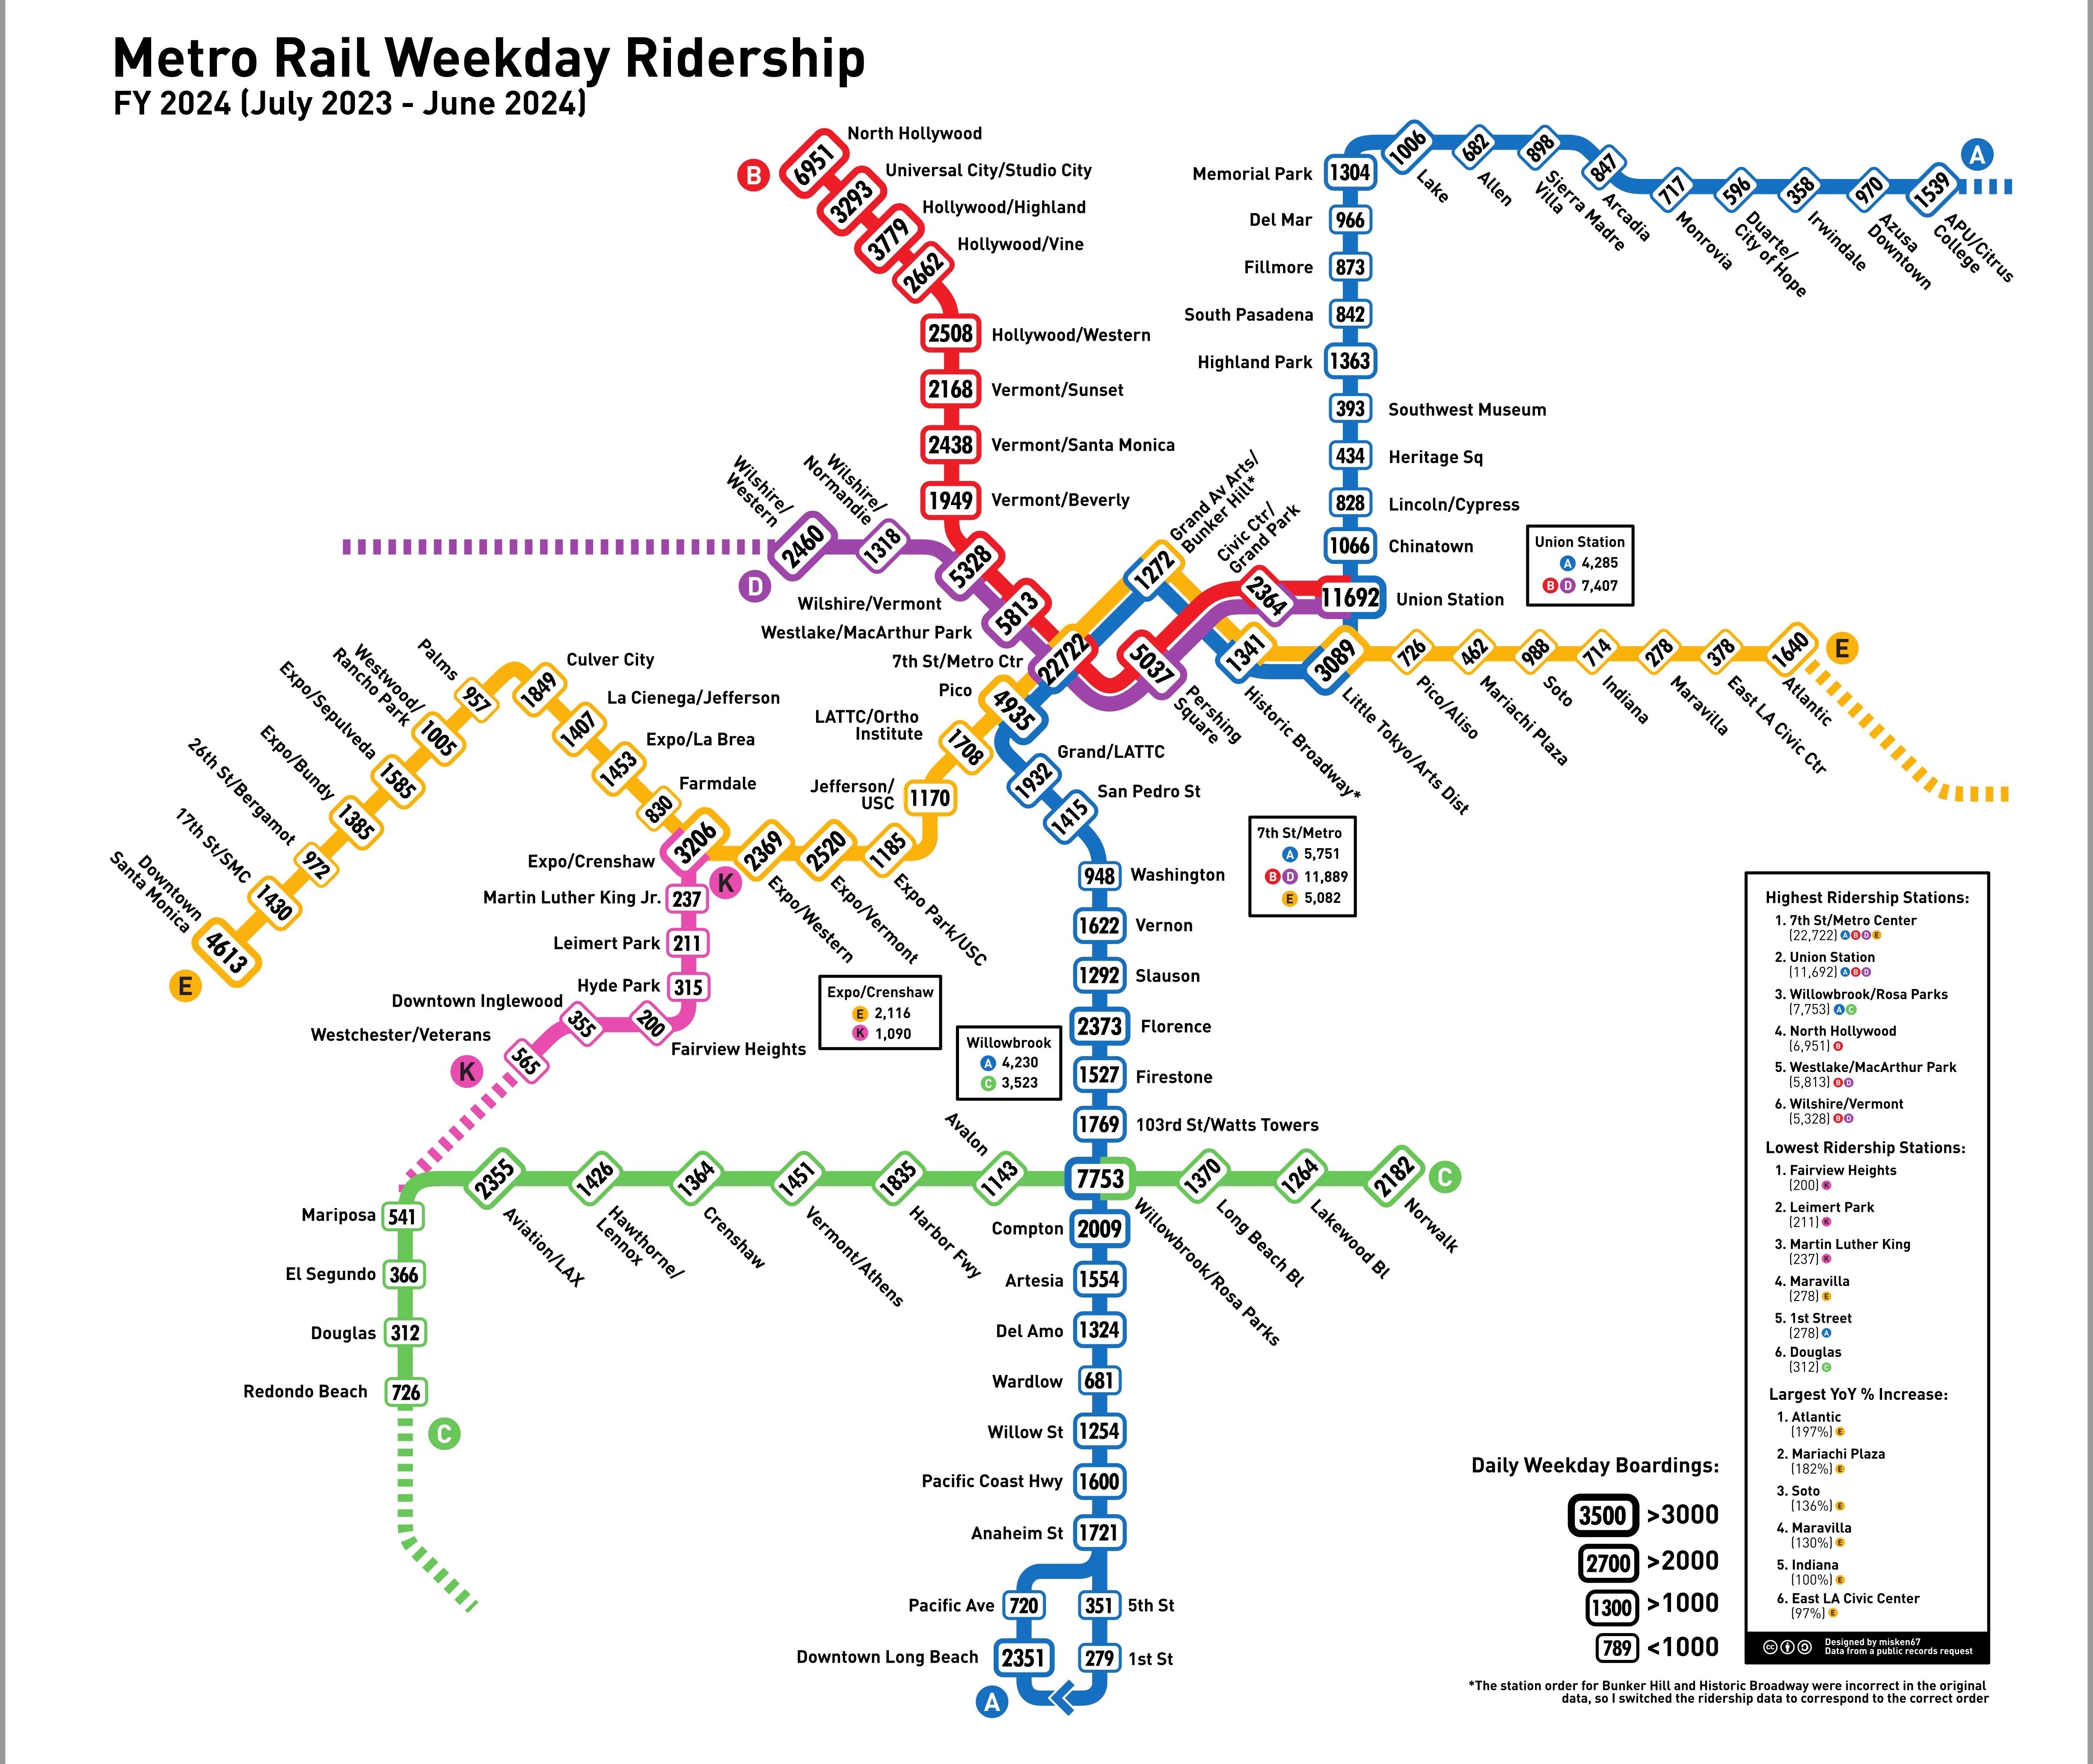
For the past two fiscal years, misken67 obtained detailed Metro ridership data by station, which helps shed some light on recent trends. Below are the fiscal year 2022-23 and fiscal year 2023-24 ridership mapped by station. (Click on images to enlarge – or follow links to Reddit posts for best resolution.)
Here is a map that also includes Bus Rapid Transit (BRT) lines.
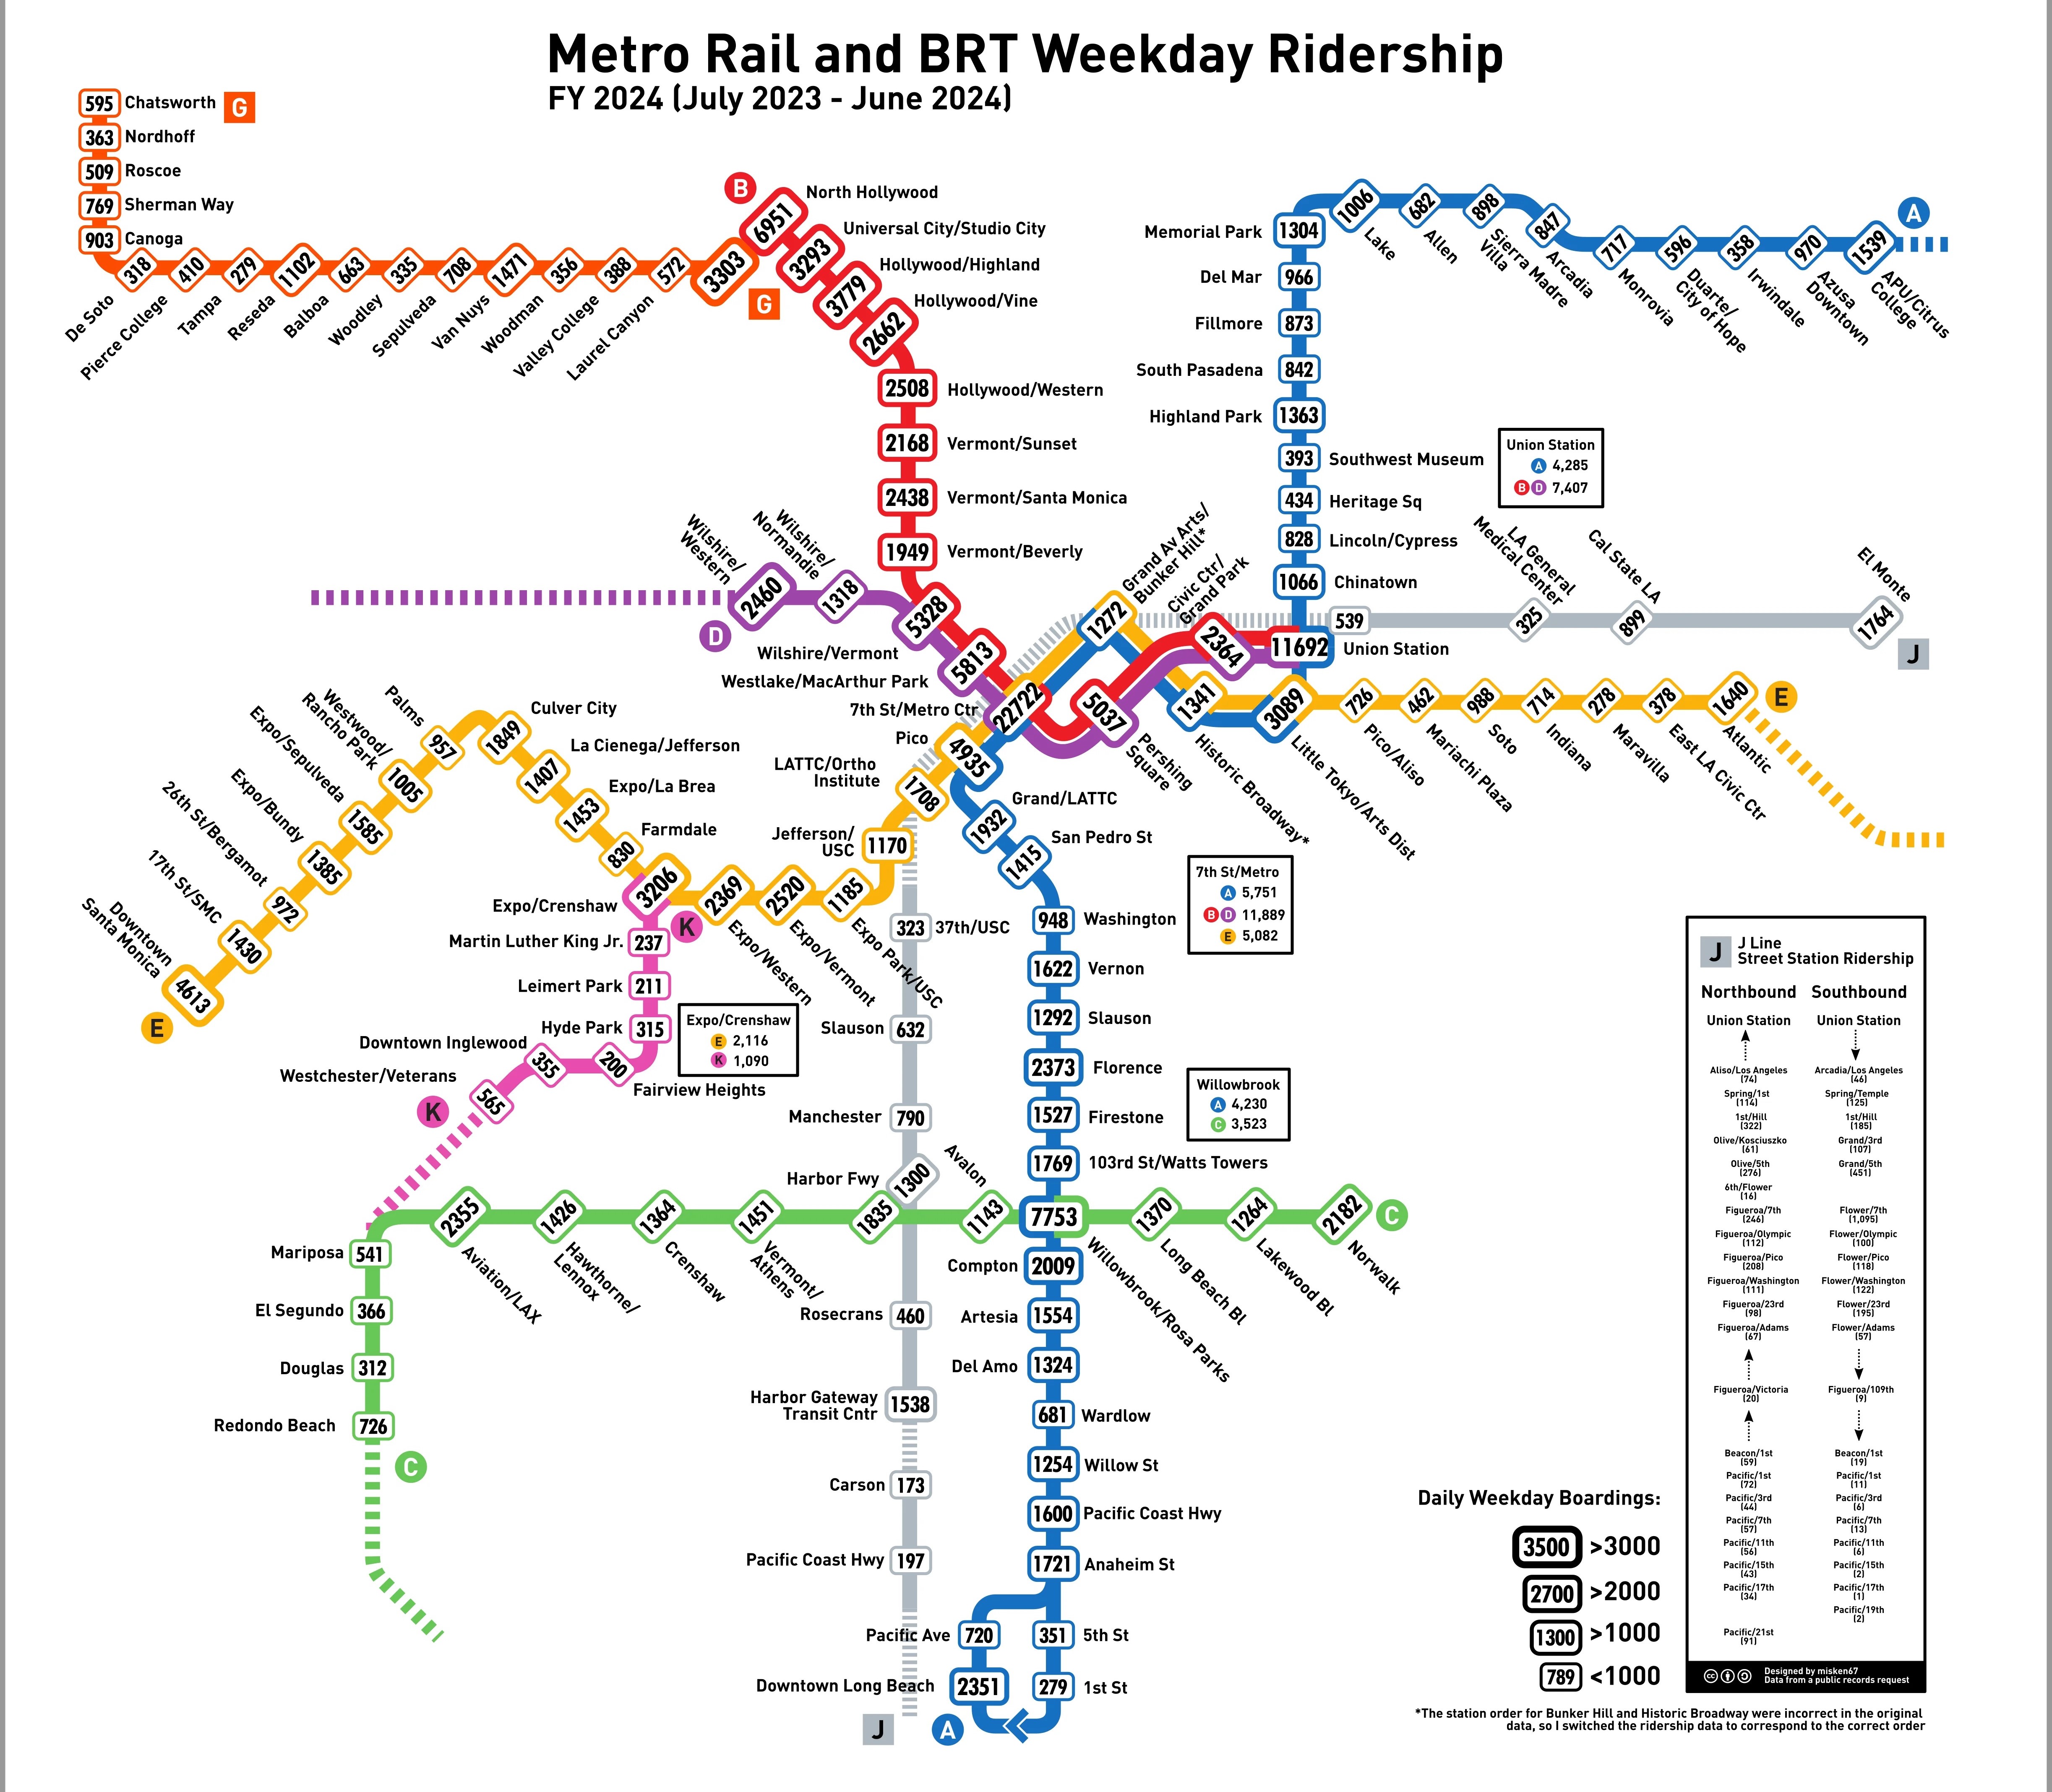
Misken67’s ridership by station post includes a substantial explanation of trends observed. Here’s their TLDR summary of FY24 trends:
New infrastructure (Regional Connector and K Line) are doing great. Strong post-covid recovery in general, and particularly strong recovery for stations affected by closures in previous years. Few light rail stations lost ridership, but nearly all heavy rail stations did. 7th/Metro Center is a beast.
Below are a few more specific observations gleaned from the original post. First the positives:
- Little Tokyo already has (very slightly) higher ridership than it did in 2019 pre-closure.
- The Eastside A Line is recovering quickly after being cut off from the rest of the system for a few years. Six of the seven ELA stations made up the top six of stations with the largest year–over-year percentage increase, with Atlantic coming in at a whopping 197 percent increase.
- After the Eastside A Line stations, the next four top ten stations with the largest increases are all K Line stations, with Inglewood performing the best at plus 95 percent.
- 7th/Metro is an insane workhorse. I believe these numbers make it the highest ridership transit station in the U.S. west of the Mississippi (only BART’s Embarcadero station rivals it).
And some negatives:
- Seven light rail stations lost ridership since FY23. Four were on the C Line segment between Mariposa and Redondo Beach that suffered intermittent closures this year.
- Every heavy rail (B/D Red/Purple Lines) station, except for Universal, lost ridership. Some of this can be attributed to the Regional Connector eliminating the need for transfers (Union Station down 30 percent, Civic Center down 25 percent, and Pershing Square down 15 percent) and others appear to be due to intermittent D Line extension construction closures (Wilshire/Western down 29 percent). For what it is worth, SBLA touched on B/D Line ridership issues in late 2023 (these subway lines carry very large numbers of riders, but have been somewhat slow to recover from pandemic losses.)
Misken67 also posted graphs of weekday passenger loads for several Metro lines. These graphs use station data to show how many passengers are on-board over each line.
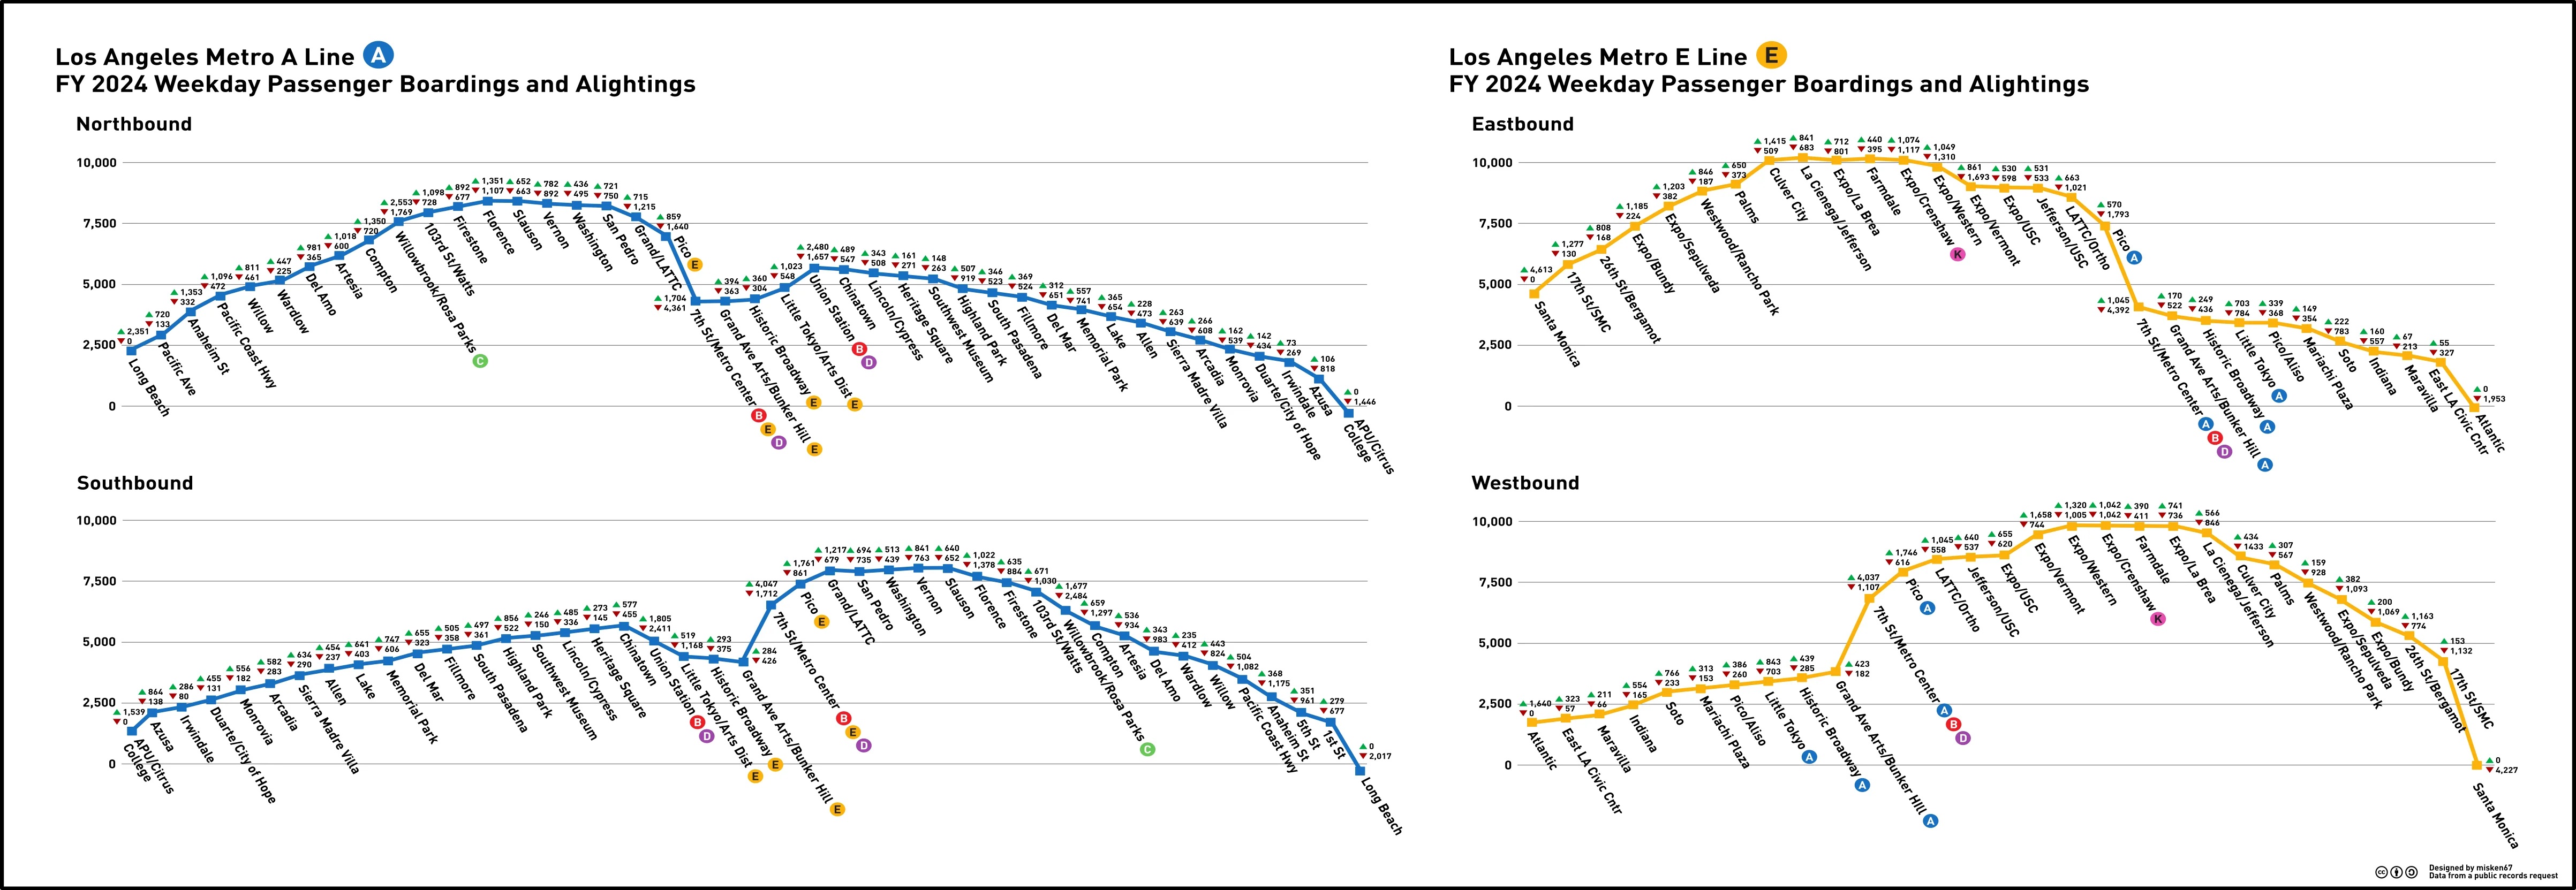
Read misken67’s observations, which include a strong call for full signal preemption for trains carrying lots of people:
- The E Line from West L.A. to downtown L.A. is the most crowded segment of the entire LRT (light rail) system.
- The second most crowded segment is the A Line in South LA – from downtown L.A. to the C Line.
- At specific South L.A. intersections (near USC) 17,000-19,000 Metro riders wait while the city prioritizes 350-400 to maybe 1,000 cars. Specifically misken67 urges the city Transportation Department (LADOT): “these are all intersections that should be closed to cars, or at least give the trains absolute signal preemption. There is no traffic or congestion concern with this low level of car traffic, and this point is just insulting to transit riders.”
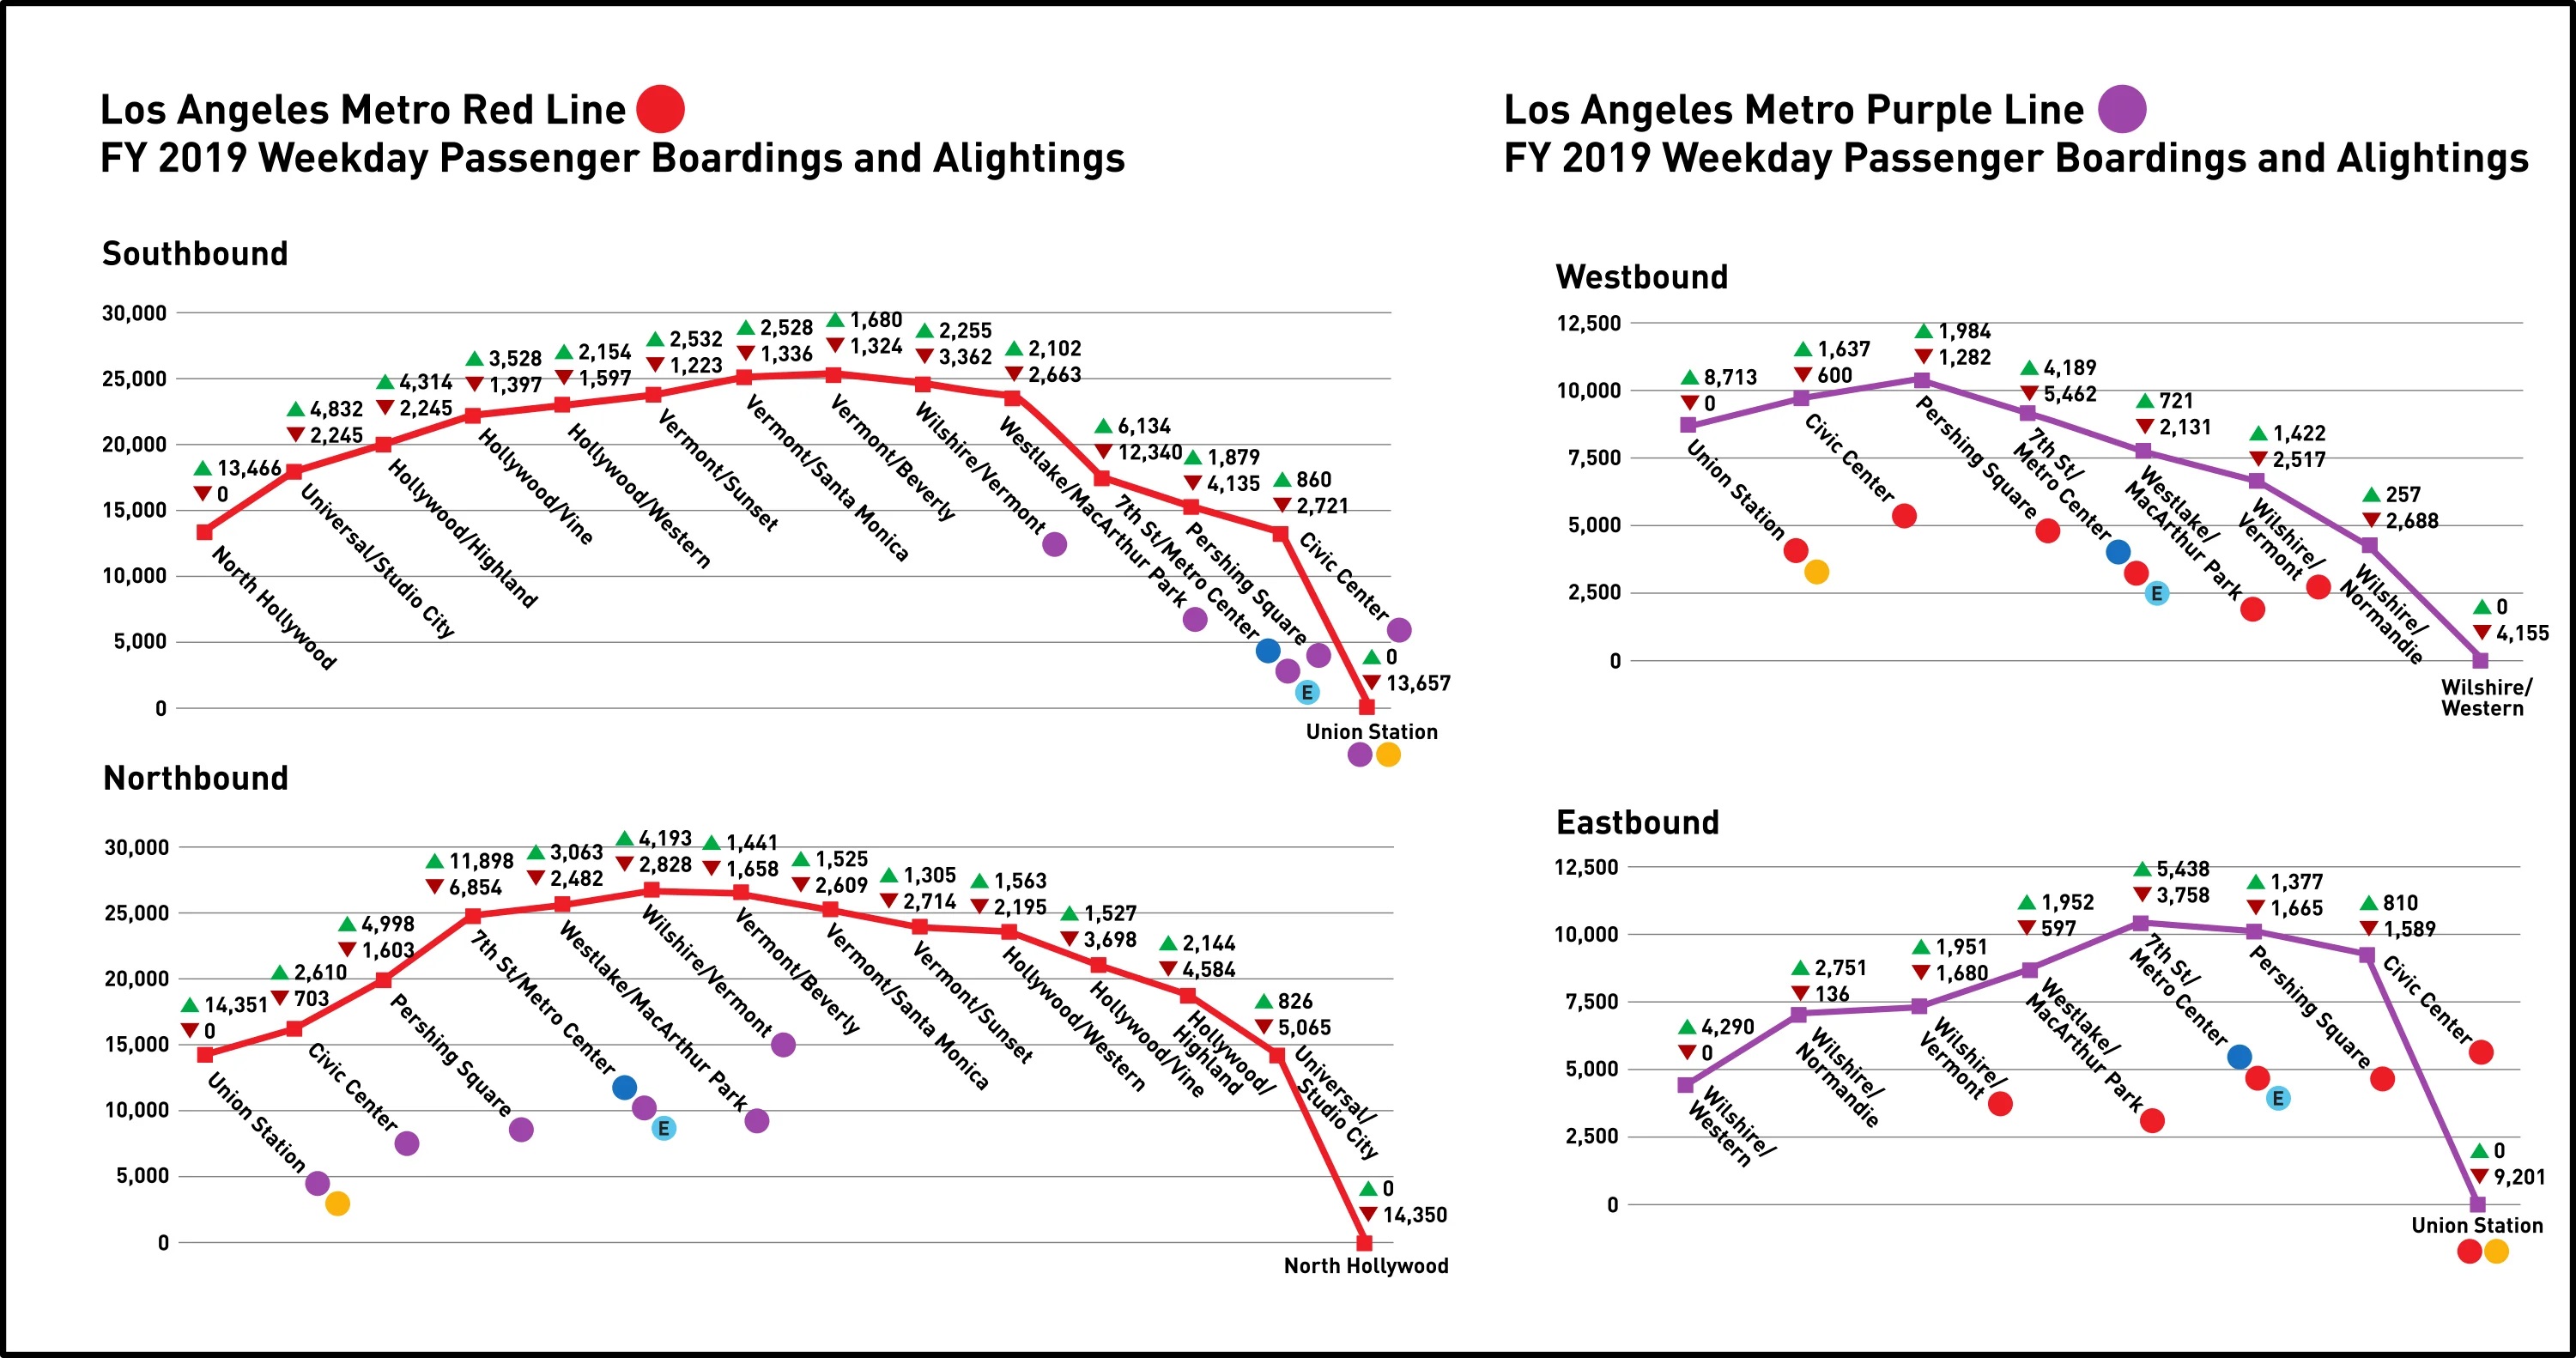
Lastly misken67 also shared pre-pandemic load figures for the B and D Lines.

Streetsblog has migrated to a new comment system. New commenters can register directly in the comments section of any article. Returning commenters: your previous comments and display name have been preserved, but you'll need to reclaim your account by clicking "Forgot your password?" on the sign-in form, entering your email, and following the verification link to set a new password — this is required because passwords could not be carried over during the migration. For questions, contact tips@streetsblog.org.