(This is the fifth in a series of posts by Hayden AI, one of our advertising sponsors. Hayden AI is a global leader in smart enforcement technologies powered by artificial intelligence. Find out more about how their digital traffic enforcement platform increases safety, efficiency, and sustainability at Hayden.ai. Read the rest of the series here.)
Bus lanes help keep buses moving on time. But when cars and trucks are illegally parked there, buses get massively delayed – increasing trip length and carbon emissions. Average bus speeds across the United States reach no more than 12 mph. In Los Angeles, the average bus speed was found to be 10.8 mph.
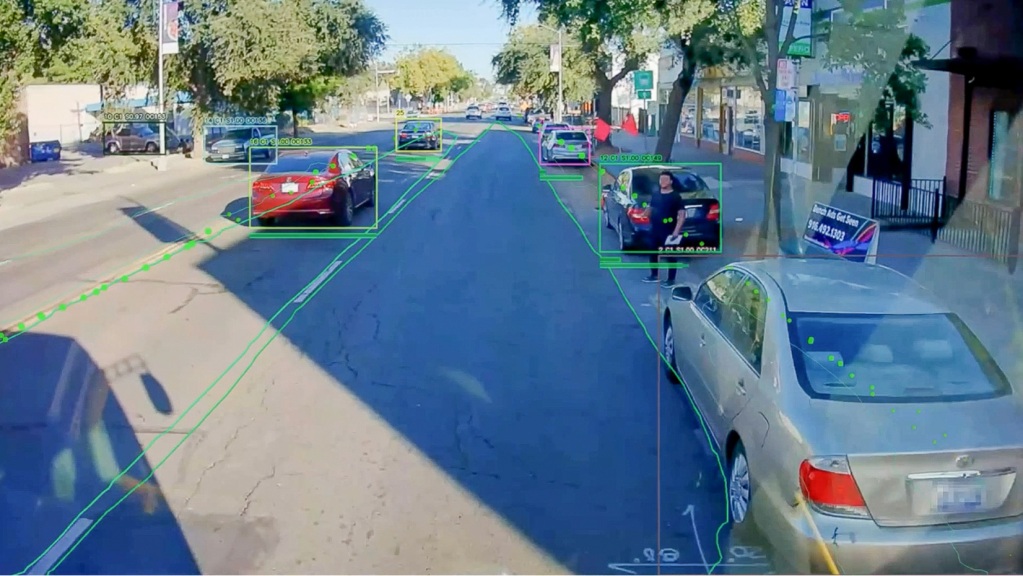
Automated bus lane enforcement can help transit agencies increase bus speeds – and reduce emissions – by keeping bus lanes clear for buses. By scaling bus lane enforcement with cameras powered by artificial intelligence, transit agencies can change driver behavior to significantly reduce illegal parking in bus lanes.
At Hayden AI, we built an emissions calculator to help transit agencies calculate how many greenhouse gas emissions they can reduce by deploying our automated bus lane enforcement platform. Using publicly available data from the Bureau of Transportation Statistics, past ABLE deployments, and the EPA’s Greenhouse Gas (GHG) Equivalencies Calculator, our calculator outputs the number of metric tons of GHG emissions saved by automated bus lane enforcement, and what these amounts mean in an everyday context, such as gallons of gas saved or number of smartphones charged.
For example, if an agency uses 100 buses to operate transit routes that use bus lanes, with automated bus lane enforcement they can expect to reduce greenhouse gas emissions by 216 metric tons per year. That’s the same amount of GHG emissions emitted to charge 479 million smartphones, or 1 million miles driven by an average gasoline-powered vehicle.
To build this calculator, we wrote a simple equation using publicly available data. First, we multiplied the number of buses operating on bus lanes by average mileage for transit buses per year using National Transit Database data. Next, we multiplied that number by the average miles per gallon for buses in the US, which is 3.4 mpg. We converted this number to gallons of CO2 emissions, then metric tons of CO2.
To then estimate how Hayden AI’s Automated Bus Enforcement platform could reduce emissions, we divided the number of metric tons by 0.3, as the MTA found that automated bus enforcement increased bus speeds by 30%. We used the EPA’s Greenhouse Gas Equivalencies Calculator to equate these emissions savings into various measures for comparison.
The good news for California transit agencies is that deploying automated bus lane enforcement technologies has now been authorized by the state. AB 917, passed in 2021, allows transit agencies to enforce bus lanes with camera-based technology. It also allows agencies to enforce bus stops, where illegal parking slows down buses and prevents riders from safely and accessibly boarding and exiting buses – an important issue we covered in-depth in this Streetsblog article.
The environmental benefits of increasing bus speeds through automated bus lane enforcement are clear. At Hayden AI, we're proud that our mobile perception platform can help transit agencies advance their environmental goals.
A version of this article was originally published on www.hayden.ai
