At this morning's Metro Measure M Independent Taxpayer Oversight Committee meeting, staff reported on the extent to which Metro sales tax Local Return funding increasingly just goes to support driving.
This Local Return program is part of Metro's countywide Measure M sales tax. Metro collects sales tax revenue and passes that money to municipalities - 88 cities and L.A. County - to spend on transportation. Cities receive funding on a per capita basis.
And they spend it on cars and their drivers.
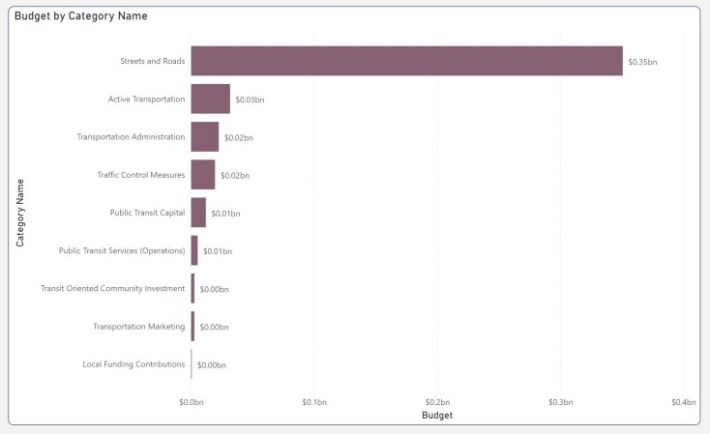
Well, about 80 percent of it. This is despite cities having flexibility to use Local Return money for hard-to-fund transit operations, transit-oriented housing (for transportation components - see Metro guidelines), or active transportation - biking and walking.
Unfortunately this isn't really news. The last time Metro shared its local return funding breakdown - back in late 2021 - SBLA reported briefly on how car-centric this pot of money was.
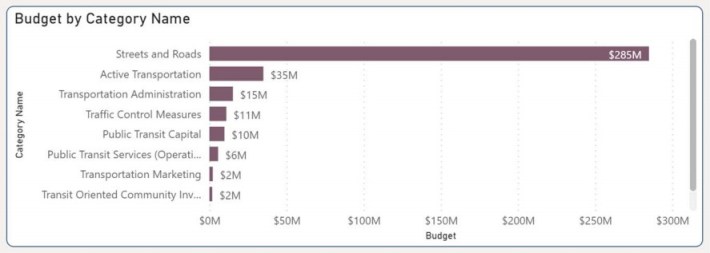
Local Return has actually gotten slightly worse since 2021. Cumulative totals show Car centric categories (Streets and Roads, Traffic Control which is basically traffic signals) have increased (from 81 to 82 percent), while green transportation categories (Active Transportation, Public Transit, etc.) shrank (from 15 to 11 percent) [see SBLA spreadsheet]. Transportation Administration's percentage has grown.
Is it Metro's fault? Not especially. Metro collects this "pass-through" money then sends it to cities with few strings attached. There are similar pass-throughs for other county sales taxes: Measure R, Proposition C, and Proposition A.
Metro could and should adjust its guidelines to make greener and more equity-focused category requirements less restrictive. (And, perhaps Metro could incentivize car-centric projects to include complete streets components, and not harm equity - say, like in accordance with Metro's adopted Complete Streets and Equity policies? Unfortunately that looks like a heavy lift, as various cities would likely resist Metro telling them not to just funnel their money into car projects.)
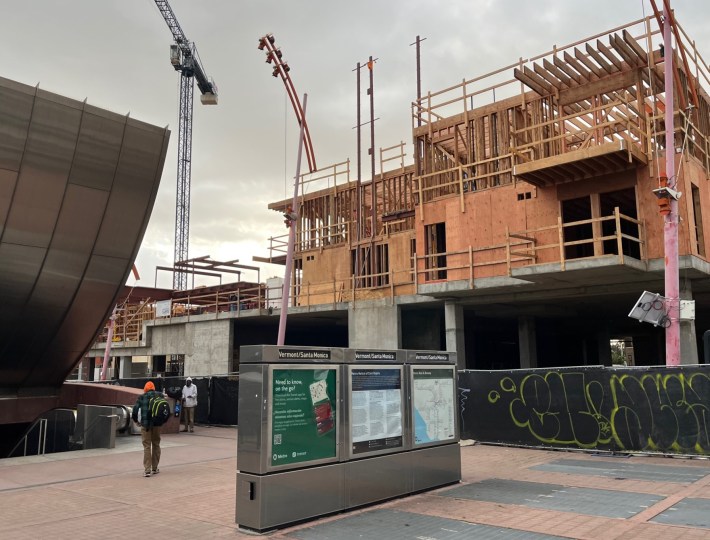
One place to start would be the Transit Oriented Communities Investments guidelines. If the South Bay can spend Measure M money on fiber optic internet cables, then surely cities can find a sufficient transportation nexus to fund building transit-oriented affordable housing. Great projects - like Little Tokyo Services Center's hundred percent affordable mixed-use above the Santa Monica Boulevard subway station in East Hollywood - include various components (curb-work, a pedestrian plaza, even very limited parking, driveways, and probably more) that Metro Measure M funding pays for elsewhere. But, really, shouldn't pretty much all affordable Transit-Oriented Development expenses just be eligible?
Perhaps Mayor Karen Bass could shepherd more of L.A. City's considerable Measure M funding (a rough estimate looks like $180+ million $60-70 million annually) toward TOC housing?
(Dollar figures corrected 3/2/2022. Streetsblog initially incorrectly took Metro's reported Local Return dollar totals as annual amounts, but the Metro figures are overall cumulative totals. Thanks to @numble for pointing this out in the comments.)
