Looking for Trends in Metro’s Latest Rail Ridership Numbers
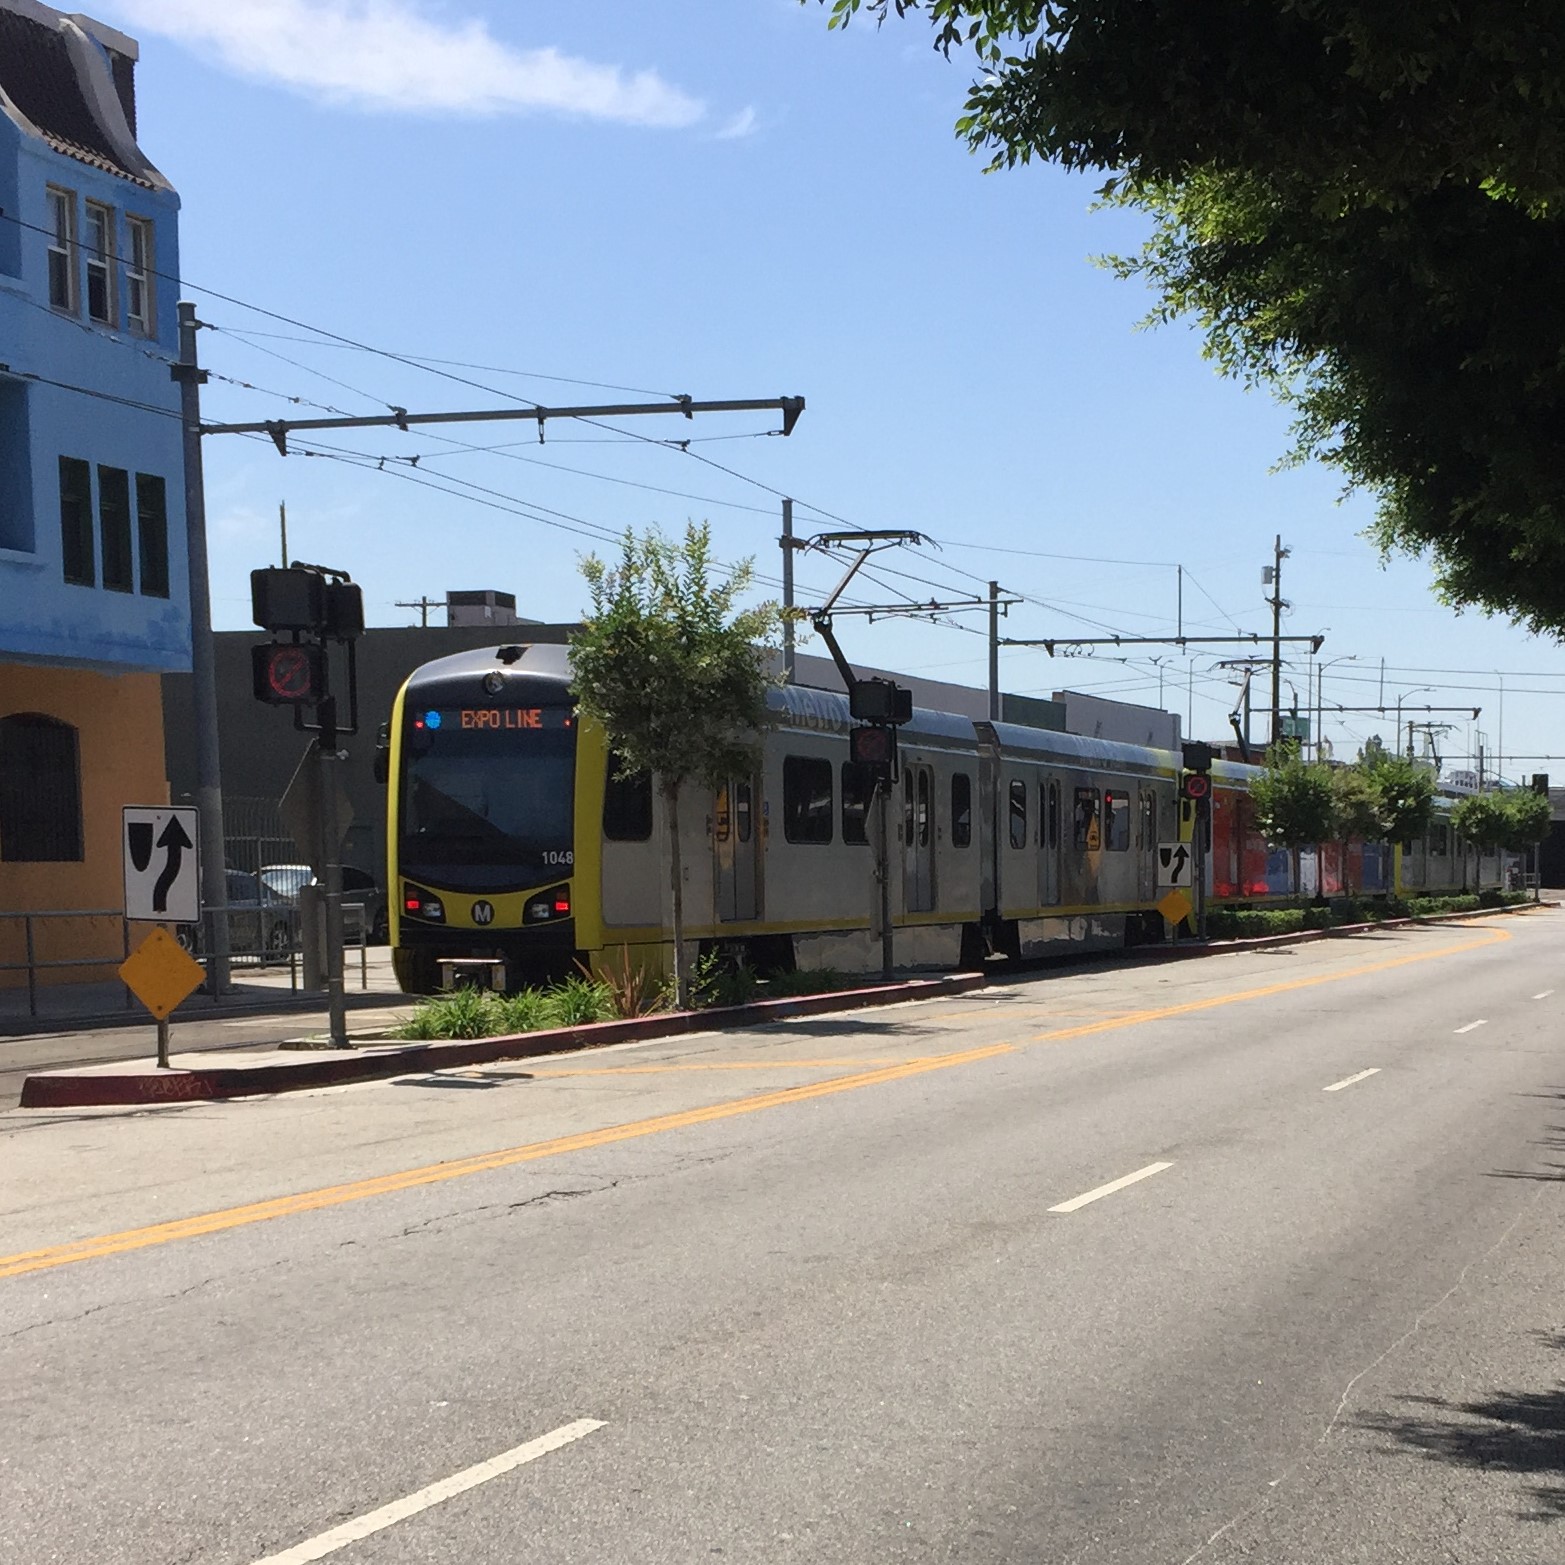
Metro Expo Line – photo by Joe Linton/Streetsblog L.A.
Metro recently released its latest fiscal year rail ridership numbers. Scott Frazier tweeted out his spreadsheet ranking station ridership and calculating year-by-year percentage changes. Overall rail ridership is basically flat, with Blue Line ridership falling due to current New Blue construction. (Note: corrections made 9/3 - original post had in one place incorrectly reported Red Line boardings as overall rail boardings)
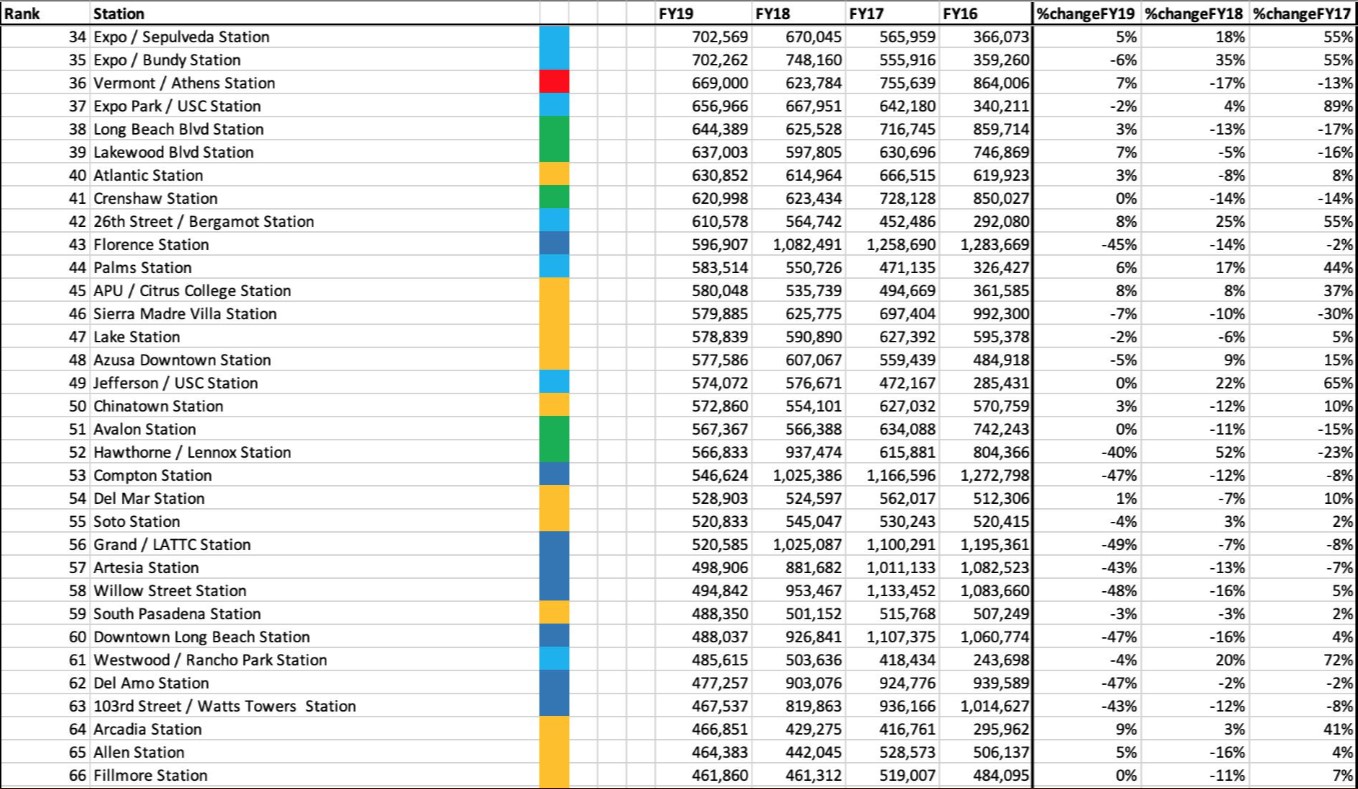
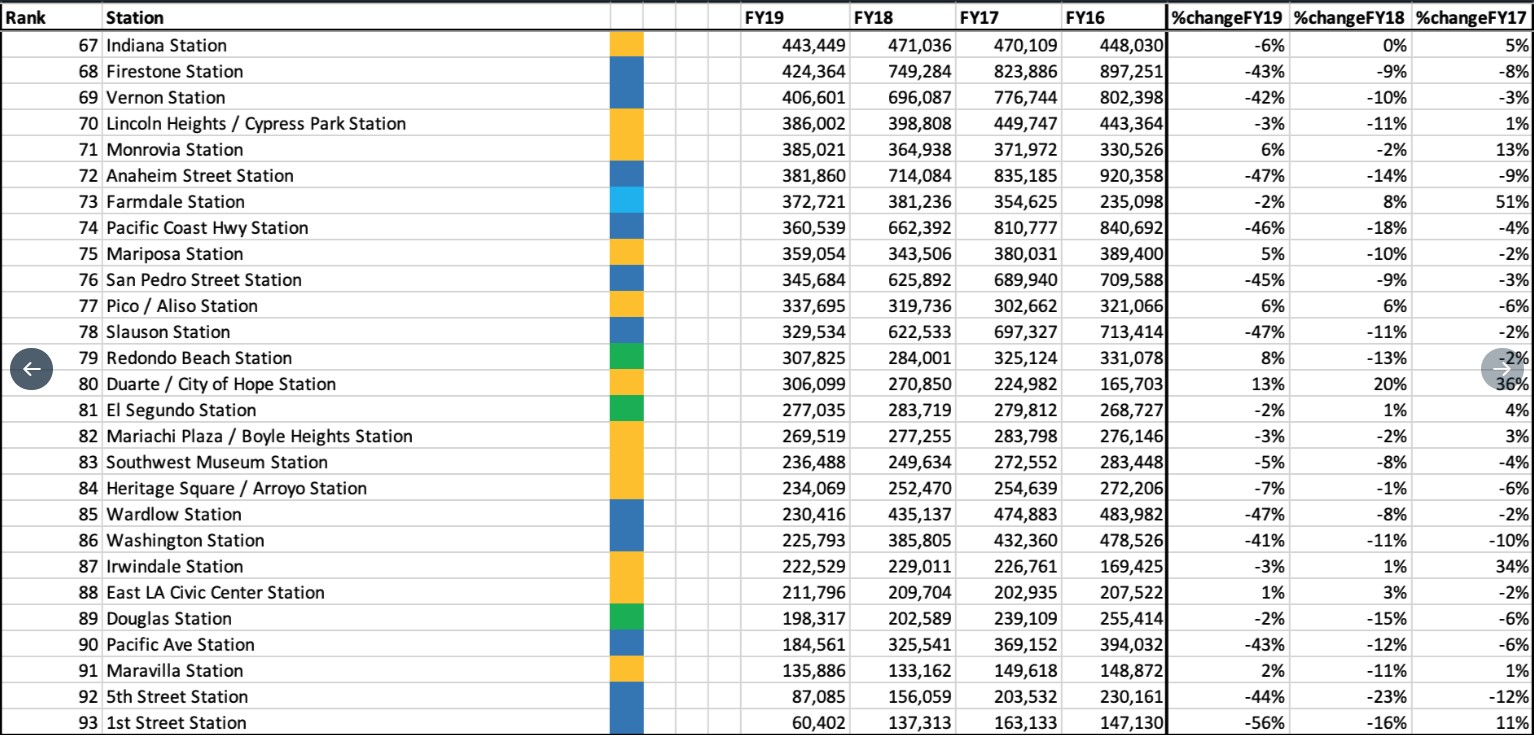
Below are Frazier's full spreadsheets, with stations ranked by annual boardings.
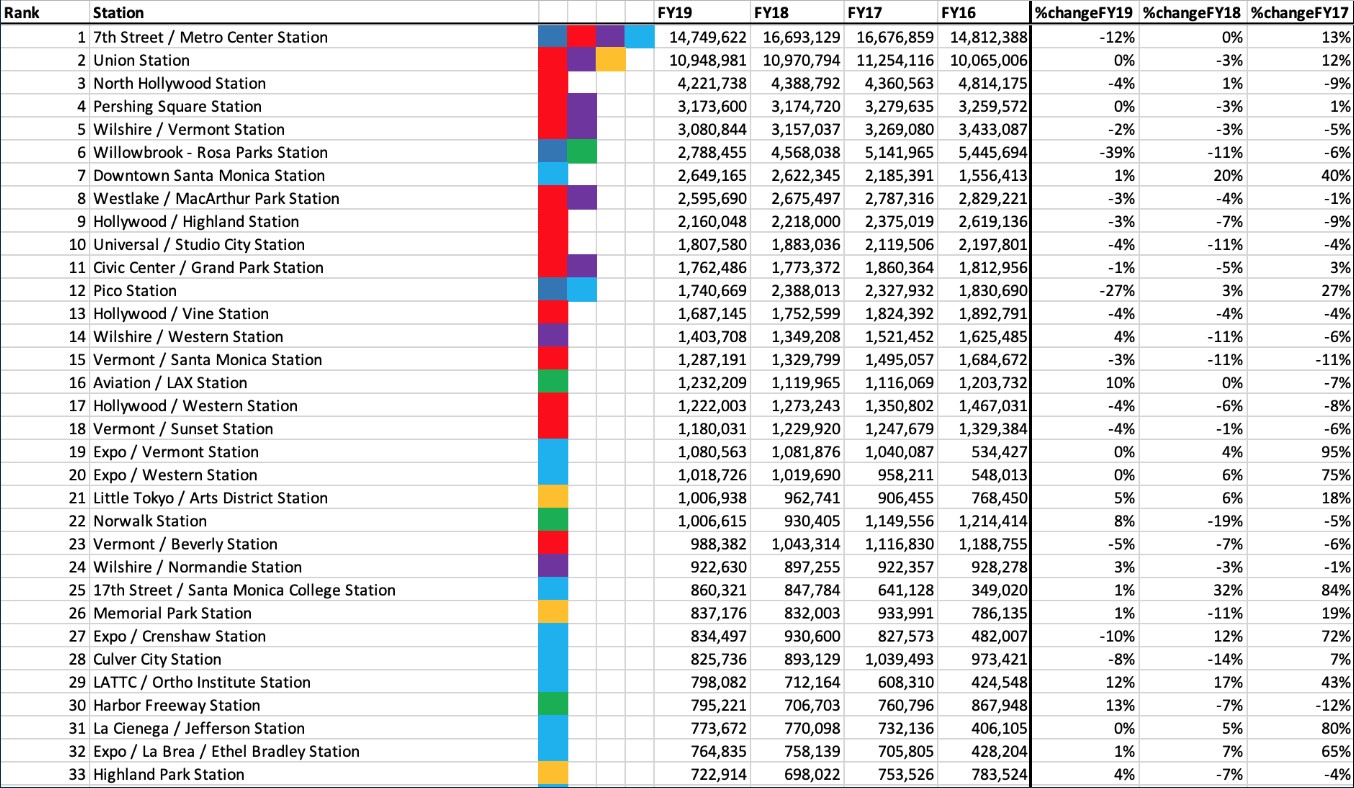
Earlier Frazier tweeted a similar chart based on weekday daily boardings, and posted annual ridership ranking information at his blog.
FY19 ridership has been impacted by Metro's New Blue rehabilitation project. For the FY19 time frame, New Blue has meant that half of the Blue Line was closed about 40% of the year (late January through June) and a pair of Expo stations were closed for nearly two weeks. Most Blue Line stations show 40+ percent drops in ridership.
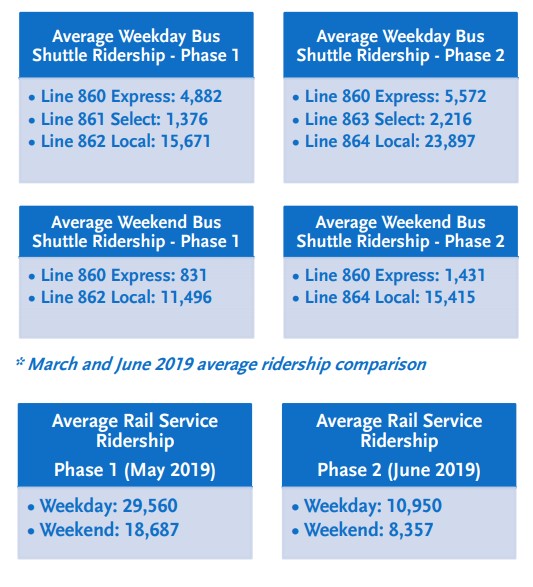
During New Blue, a lot of Blue Line riders shifted from rail to shuttle bus ridership, but some ridership essentially disappeared; riders likely shifted to other transit lines or other modes, or did not travel. In 2018, typical weekday Blue Line ridership was 60,000+. While the lower blue line was closed (phase 1 of New Blue - late January to late May 2019) Blue Line weekday ridership dropped by half - to ~30,000, with shuttle buses carrying ~22,000 (with about 8,000 per day disappeared.) When the upper blue line was closed (phase 2 of New Blue - starting late May 2019, expected to conclude late September) Blue Line weekday ridership dropped further to ~11,000 with shuttle buses carrying ~32,000 (about 17,000 per day disappeared.)
It is possible that the Blue Line ridership losses spilled over onto rail lines it connects to: Green, Purple, Red, and to some extent Expo. Although there does not appear to be any pattern showing declines in stations near the Blue Line.
It may be perilous to draw definitive conclusions on how a single year reflects any larger trends. Nonetheless, there has been a fair amount of discussion via Twitter.
Some are suggesting that the latest ridership numbers could indicate that (at least for rail) Metro's declining ridership appears to be leveling off.
(Correction 9/3 - The initial version of this post incorrectly reported Red Line boarding figures as overall rail boarding figures.
Looking at the bigger picture - rail-system-wide annual boardings - the rail ridership decline is worse. Per Metro statistics portal, overall ridership for FY17 and 18 and 19 were: 113,397,844 and 110,139,493 and 102,729,642 respectively. The FY18 decline was -2.87% and for FY19 the decline did not level off, but worsened at -6.73%. Rail ridership peaked in FY2014 at 114,069,572. Overall rail ridership got a ~5% bump in FY17, with the first full year for newly opened extensions on Gold and Expo Lines. Since FY17, overall ridership has trended downward. This overall trend did not level off in FY19. The lack of leveling off may be due to Blue Line construction. See some Metro ridership stats at this SBLA spreadsheet.)
The leveling off is most apparent in the highest ridership heavy rail lines. For almost all Red and Purple Line stations, ridership changes from FY18 to 19 are better than changes from FY17 to 18. For these stations for the past year, rarely did ridership grow; it largely held steady or declined only slightly. Several Red/Purple Line stations went from double-digit losses to single-digit losses (Red Line examples: Universal went from -11% to -4%, and Vermont/Santa Monica went from -11% to -3%.)
Frazier pointed out that, for FY19, overall rail Red Line ridership declined only slightly - less than 1%. Based on weekday rail boardings, FY19 saw a -0.7% decline, which is an improvement compared to the prior year's -4.7% decline. Though -0.7% is still a decline, given New Blue construction losses/shifts possibly spilling over onto the Red Line, Metro rail Red Line ridership arguably pretty much held even.
As noted above, Blue Line ridership is down due to New Blue. Though ridership was down all along the line, the biggest percentage drops are at the south end of the Blue Line, which was closed from late January through late May.
Stations where ridership grew most are spread out over Expo, Green, and Gold Lines. Some of these growth stations are at parking-rich stations at/near suburban termini (APU, Lakewood, and Atlantic), perhaps indicating success in Metro's recent roll-out of its paid-parking policy.
Many of the ridership increases are at relatively low-ridership stations. This is good news, but contributes relatively little to overall ridership. For example, the Foothill Gold Line's APU station boardings jumped 8% (annual boardings went from 535,739 to 580,048 in FY18 to FY19). This is great, but APU still ranks 45th out of Metro's 93 rail stations, more than 20 of which see a million-plus annual boardings.
Next year's FY2020 ridership may be similarly difficult to draw conclusions from. FY2020 will definitely include New Blue closures: ~3 months of north Blue Line, and 2 months of Expo Line stations in downtown L.A. As shown in the Metro stats above, the current second phase of Blue Line closures are likely to have a worse impact on overall ridership than the first phase, as ridership is higher toward the north end of the line. In its FY2020 budget, Metro cut rail service on the Blue, Expo, and Gold lines. If all goes surprisingly well with construction and testing, the new Crenshaw/LAX Line could potentially open in June, though it appears likely that Crenshaw will open in FY2021.
Readers - what trends do you see in these Metro ridership numbers?
Stay in touch
Sign up for our free newsletter
More from Streetsblog Los Angeles
No, L.A. City Does Not Always Add Required ADA Ramps During Resurfacing, But They Should
StreetsLA GM Keith Mozee "Any time we do street resurfacing, it is considered an alteration, which requires ADA ramps to be installed."

LAPD Was Crossing Against Red Light in Crash that Killed Pedestrian and Injured Six in Hollywood
The department says the officers had turned on their lights and sirens just before crossing, but won't say why they did so.