Why Is Transit Ridership Falling?
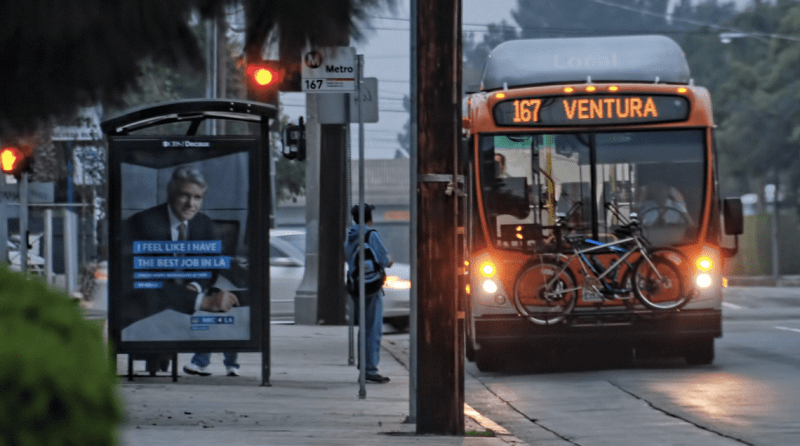
Transit ridership took a turn for the worse in 2016. In all but a handful of cities, fewer people rode trains and buses, even in some places, like Los Angeles, that have invested significantly in expanding capacity.
It’s not just a one-year blip, either. In many American cities, the drop in transit ridership is an established trend. The big question is why.
Transit consultant Jarrett Walker at Human Transit wants more than vague speculation about the effect of low gas prices and ride-hailing services. He’s looking for more specific research about causes and effects — and soon:
Bottom line: We need research! Not the sort of formally peer reviewed research that will take a year to publish, but faster work by real transportation scholars that can report preliminary results in time to guide action. I am not a transportation researcher, but there are plenty of them out there, and this is our moment of need.
Here are my research questions:
- Which global causes seem to matter? Straight regression analysis, once you get data you believe. Probably the study will need to start with a small dataset of transit agencies, so that there’s time to talk with each agency and understand their unique data issues.
- What’s happening to the quantity of transit? If ridership is falling because service is falling, this isn’t a surprise. If ridership is falling because service is getting slower — which means lower frequency and speed at the same cost — well, that wouldn’t be surprising either.
- How does the decline correlate to types of service? Is this fall happening in dense areas or just in car-based suburbs? Is it happening on routes that are designed for high ridership, or only on those that are designed for coverage purposes (services retained because three sympathetic people need them rather than because the bus will be full). Is it correlated to frequency or span changes? Heads up, local geeks! A lot could be done looking at data for your own transit agency — route by route and even (where available) stop by stop, to analyze where in your metro the fall is really occurring.
More recommended reading today: Green Caltrain looks at whether Bay Area cities are adapting to new rules designed to promote low-car development. And Urban Milwaukee floats the idea of using voluntary bike registration fees to pay for bike infrastructure.

Read More:
Streetsblog has migrated to a new comment system. New commenters can register directly in the comments section of any article. Returning commenters: your previous comments and display name have been preserved, but you'll need to reclaim your account by clicking "Forgot your password?" on the sign-in form, entering your email, and following the verification link to set a new password — this is required because passwords could not be carried over during the migration. For questions, contact tips@streetsblog.org.