Explore National Transportation Change Trends by Age Group
Cross-posted from City Observatory
In some ways, the urban renaissance of the last decade or two has been quite dramatic. Downtown or downtown-adjacent neighborhoods in cities around the country have seen rapid investments, demographic change, and growth in amenities and jobs. Even mayors in places with a reputation for car dependence, like Nashville and Indianapolis, are pushing for big investments in urban public transit.
Because many of those who work in urban planning live in or near these walkable, transit-served neighborhoods, it may be easy to imagine that their changes are representative of the overall pace of transition to a more urban-centric nation. Butas we and others have discussed before, in at least one way — transportation — change has actually been excruciatingly slow at the national level.
According to the American Community Survey, from 2006 to 2014, the proportion of people using a car to get to work declined — from 86.72 percent to 85.70 percent. Even among young people, the shift seems underwhelming: from 85.00 percent to 83.94 percent. (Though, as we stressed last week, these Census data only cover journey-to-work trips and tend to overstate the extent to which households rely exclusively on cars for their transportation needs.)
The changes for transit, biking, and walking are, obviously, similarly small. Transit mode share increased from 4.83 percent to 5.21 percent; among those 20 to 24, the increase was 5.53 to 6.35 percent. The overall share of walking commutes actually fell.
In fact, we’ve built a little tool to let people explore these data in an interactive way, selecting mode type and age ranges to see how things have changed, and haven’t, over the last almost-decade. The tool displays the same data in two ways: first, as a graph (above), and then as a simple table (below), for those who find that easier to read. (On the graph, yes, we have allowed the y-axis to begin at numbers larger than zero — in large part because the changes are so small that a chart that began at zero would be unintelligible. We will trust our readers to be sophisticated enough at reading graphs to understand.)
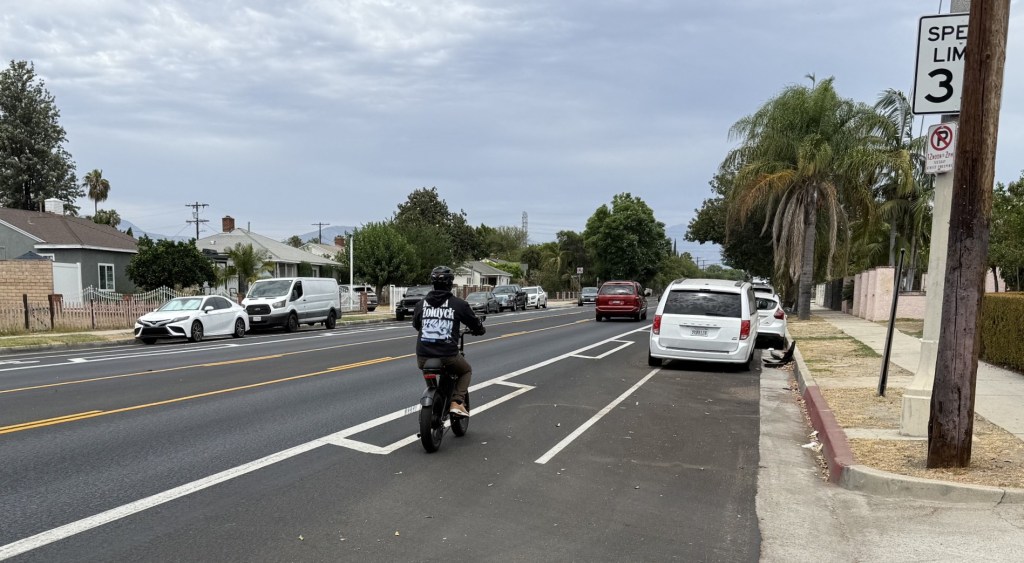
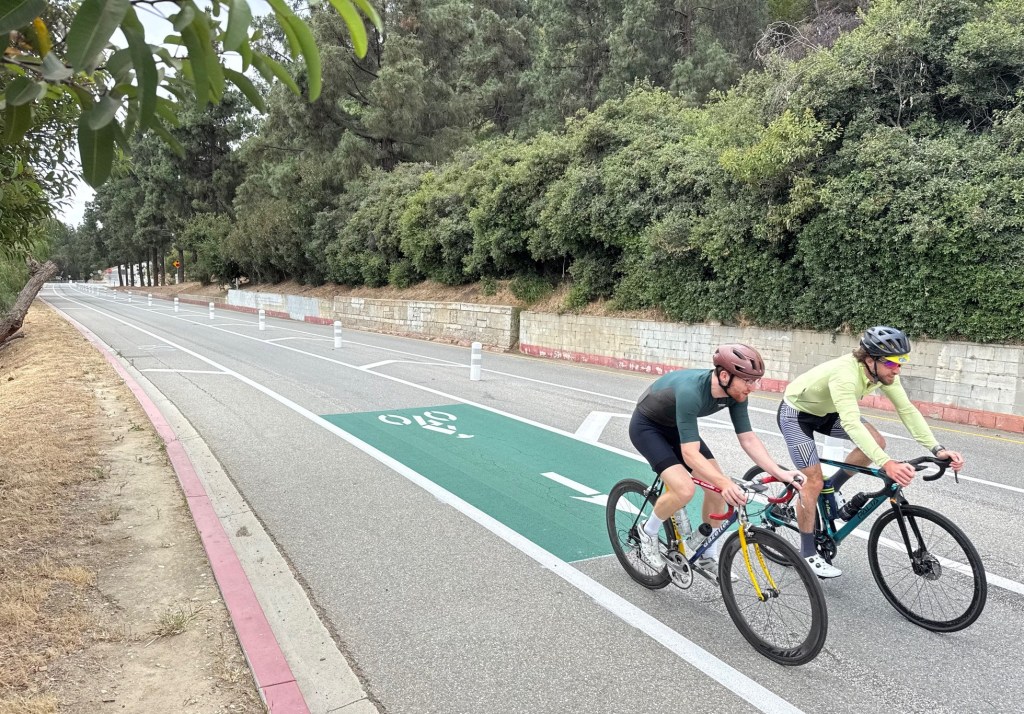
So what’s going on here? Well, as we wrote about just last week, the single greatest determinant of people’s transportation choices isn’t what mode they think is the coolest — or even whether there’s a train or bus station nearby, though that obviously helps. The most important factor is their city’s land use pattern: are there things close by to walk to? Is the city compact enough — and pedestrian-friendly enough — that there’s an fast, safe, and pleasant way to get from a transit stop to their place of employment? When you step out of a train station, do you see this:

…or this:

This kind of built environment doesn’t change nearly as fast as attitudes — or as quickly as jobs can relocate from suburban office parks to downtown lofts. But it does change, and it’s why we insisted last week that thinking about “the future of urban transportation” in terms of apps and hacks, rather than fundamental urban design, is a huge mistake.
There is more encouraging news, however: if you drill down to mode shifts by metropolitan area, the changes are much more pronounced, especially among younger people. In a follow-up post, we’ll let you see exactly how much has changed in your city.

Streetsblog has migrated to a new comment system. New commenters can register directly in the comments section of any article. Returning commenters: your previous comments and display name have been preserved, but you'll need to reclaim your account by clicking "Forgot your password?" on the sign-in form, entering your email, and following the verification link to set a new password — this is required because passwords could not be carried over during the migration. For questions, contact tips@streetsblog.org.