What’s Your City’s Ratio of Places to Non-Places?
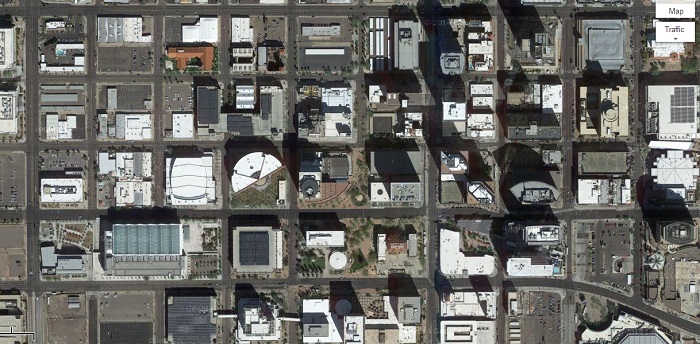
 Andrew Price used a sunburn map to highlight the places (blue) and “non-places” (red) in downtown Phoenix. Image: Strong Towns
Here’s a really interesting way to look at cities. Andrew Price at Strong Towns has developed a graphically compelling way to break down developed areas into what he calls “places” and “non-places.”
He explains:
Places are for people. Places are destinations. Whether it is a place to sleep, a place to shop, a place of employment, or simply a place to relax – it has a purpose and adds a destination to the city. Building interiors are the most common form of Places found in cities. Examples of outdoor Places include;
- Parks and gardens
- Plazas
- Human-oriented streets
Non-Places are the padding between destinations. Examples of Non-Places include:
- Roads
- Freeways
- Parking Lots
- Greenspace
Price has developed a method that instantly conveys the ratio of places to non-places. Below he compares part of San Francisco to a suburban area of Little Rock.

 Image: Strong Towns
This area of San Francisco, Price says, has a place to non-place ratio of 4.25:1 (81% place).
Now, for suburban Little Rock.

 Image: Strong Towns
This area has a place to non-place ratio of 0.08:1 (8.5% place).
Price writes:
In the above example, 10.5 times more land is dedicated to Non-Places than Places! Is this even a financially viable way to build a city? No.
Compare those examples and ask yourself — which one is more walkable (the topic of my National Gathering presentation)? Which one is getting their money’s worth out of their infrastructure?
Elsewhere on the Network today: Peninsula Transportation explains why a Silicon Valley developer prefers to offer tenants transit passes, not parking spaces. (Spoiler: It’s a whole lot cheaper.) And The Dallas Morning News’ Transportation Blog reports that as protests have erupted over a proposed new toll road, the North Central Texas Council of Governments has come under fire for potentially inflating traffic projections.

Read More:
Streetsblog has migrated to a new comment system. New commenters can register directly in the comments section of any article. Returning commenters: your previous comments and display name have been preserved, but you'll need to reclaim your account by clicking "Forgot your password?" on the sign-in form, entering your email, and following the verification link to set a new password — this is required because passwords could not be carried over during the migration. For questions, contact tips@streetsblog.org.