Density, Car Ownership, and What It Means for the Future of Los Angeles
Density. Vehicle Ownership. The number of cars packed into a small area.
These are concepts that we discuss often on Streetsblog. Thanks to a UCLA research project undertaken by Professors Mike Manville and Donald Shoup, we can get an idea of some of the challenges Los Angeles’ planners face in trying to ween our city off the automobile.
This article will look at the population density, car ownership per person, and car ownership per mile maps and charts. At the top of each article will be a “Streetsblog sized” map for Los Angeles with links to maps for San Franscisco and New York for comparison purposes. All maps are based on information from the 2000 Census.
A huge hat tip to Katie Matchett, without whom this article wouldn’t have been possible.
Population Density:
Click for population density maps of Los Angeles, New York and San Francisco.

Our first set of maps show the population density for the region. The greater Los Angeles region is often portrayed as a giant suburb. When you look at the raw number for Los Angeles, as compared to New York and San Francisco, this characterization seems suspect. After all, Los Angeles exceeds New York when it comes to person per square mile.
|
Population |
Urbanized Area (sq. mile) |
Population Density (person/sq. mile) | |
| Los Angeles |
11,874,000 |
2,980 |
3,990 |
| New York |
18,091,000 |
5,500 |
3,290 |
| San Francisco |
3,019,000 |
720 |
4,200 |
This table shows the total population, size of the urbanized area, and population density for each region. Note that while San Francisco has the highest population density, Los Angeles is more dense than New York. However, when you look at the maps you’ll see that the population is spread relatively evenly throughout Los Angeles, while the other regions have dense centers with more sprawling suburbs.
In other words, when it comes to New York, our suburbs are denser than their suburbs; even though they have a much denser urban core.
It will be interesting to see in the 2010 census how much of a dense urban core has developed over the last ten years. I suspect those dark green areas will continue to grow, but that nobody is going to start mistaking the Downtown with those of San Francisco or New York.
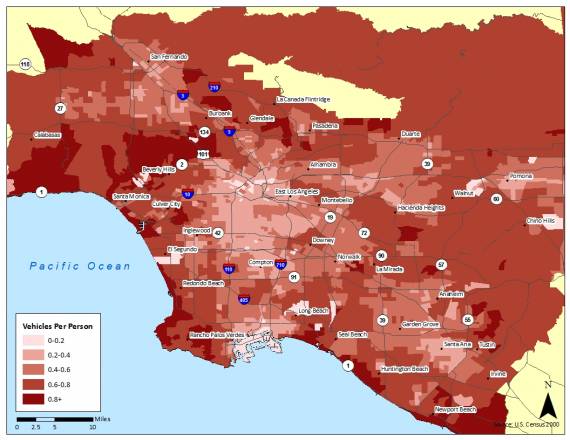
Vehicles Per Person
Click for the vehicles per person maps for Los Angeles, New York and San Francisco

It’s no surprise that New York had the lowest rate of car ownership per person, but I think that many people will be surprised to see that Los Angeles actually has a lower rate of car ownership than San Francisco. As with population density, vehicle density is more evenly distributed in LA than in the other two regions.
|
Total Vehicles In Urbanized Area |
Population |
Urbanized Area (sq. mile) |
Vehicles per Person | |
| Los Angeles |
6,433,000 |
11,874,000 |
2,980 |
0.54 |
| New York |
7,771,000 |
18,091,000 |
5,500 |
0.43 |
| San Francisco |
1,769,000 |
3,019,000 |
720 |
0.59 |
Matchett provides a couple of other facts about Greater Los Angeles, which further illustrates what does and doesn’t determine car ownership
The three tracts with the lowest vehicles per square mile and per person are located in Long Beach, downtown Los Angeles, and San Fernando. A closer examination of the demographics of each of these tracts reveals that while each has a fairly large population (between 300 and 1,000 residents), the tracts have hardly any workers or housing units. This suggests that they may contain institutional uses such as jails, where vehicle ownership rates would be very low. The downtown tract might also include homeless residents without vehicles.
The three census tracts with the highest number of vehicles per person are located in the cities of Beverly Hills, Newport Beach, and Norwalk. The Norwalk tract also includes primarily commercial uses and has only nine residents, so the high vehicle ownership rate is likely due to the tract’s low population. The two other census tracts with a high number of vehicles per person are located in some of the wealthiest communities in the Los Angeles region. Given the strong correlation between income and vehicle ownership, this should come as no surprise.
In other words, Los Angeles’ surprising low rate of car ownership seems to have more to do with income than progressive transportation ideals.
Vehicles Per Square Mile:
Click for vehicle per square mile maps for Los Angeles, New York, and San Francisco

From a planning standpoint, this set of maps and statistics, combined with the first set of maps and statistics tells the most important story. What is the impact of population density on car ownership? As we try to provide alternatives to the automobile, it stands to logic that dense development is part of the key.
|
Total Vehicles In Urbanized Area |
Urbanized Area (sq. mile) |
Vehicles per Square Mile | |
| Los Angeles |
6,433,000 |
2,980 |
2,161 |
| New York |
7,771,000 |
5,500 |
1,413 |
| San Francisco |
1,769,000 |
720 |
2,460 |
Oh, well this is embarrassing. Matchett explains.
The pattern of vehicles per square mile in each region basically mirrors the population density: tracts with high population density also have a lot of vehicles. This is true even in New York, with its lower vehicle ownership rates.
Honestly, I was surprised by this result. I wasn’t exactly stunned that this was true for Los Angeles, because our transit system still needs some development, but that car ownership in New York and San Francisco was still high in their dense, transit rich areas? I didn’t have a great explanation for this, but fortunately Matchett supplied an explanation from Professor Manville.
From a policy standpoint, this suggests that simply increasing density is likely to exacerbate rather than mitigate congestion–something we see borne out by most congestion data. (Increasing density and congestion can sometimes allow people to make more trips while avoiding congestion, but the congestion itself is still bad). So the trick for transportation and land use policy is to find ways to pull apart density and vehicle use. That’s what pricing does, and that’s what minimum parking requirements do the opposite of. Parking requirements make it very easy for increases in density to move in lockstep with increases in vehicles, because new dwelling units automatically include housing for cars.
So there’s the challenge for our local planners and transportation engineers. As Los Angeles grows and becomes more transit diverse in the coming years, the city, county and Metro needs to get rid of parking minimums in dense, transit-rich areas and find other ways to encourage people to not feel the need to own cars. It sounds as though Metro ought to be urging cities to relax their parking requirements in the areas around their new rail lines or, at a minimum, get them relaxed for the developments on land that the agency owns.

Streetsblog has migrated to a new comment system. New commenters can register directly in the comments section of any article. Returning commenters: your previous comments and display name have been preserved, but you'll need to reclaim your account by clicking "Forgot your password?" on the sign-in form, entering your email, and following the verification link to set a new password — this is required because passwords could not be carried over during the migration. For questions, contact tips@streetsblog.org.