NRDC Gives Gas Consumption Maps a Helpful Revision
The overwhelming sentiment that greeted our story on the gas consumption maps the Natural Resources Defense Council and the Sierra Club put out last week went something like this: These are almost useful. Just about everyone agreed that looking at total fuel consumption per county wasn’t very informative without weighing that number against population.
There were problems with doing per-capita fuel comparisons, but after hearing from several sources (including Streetsblog) that it was needed, NRDC’s Deron Lovaas has put out a follow-up post with new maps and charts that have, in my opinion, much more useful information.
First, the map of per-capita fuel consumption:
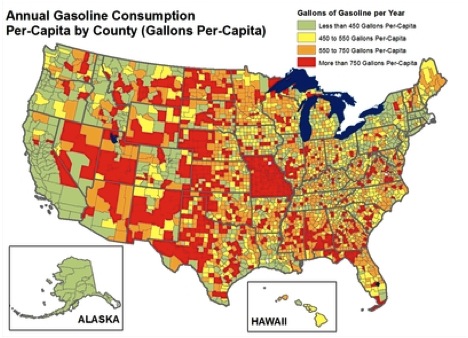
As Lovaas mentioned last week, there are problems with this map too. Some of these places are so rural and lightly populated that massive per-capita fuel consumption just isn’t a big enough problem to worry about, since there are few capitas there. Plus, there’s the problem of through-traffic — in many rural states, most traffic neither originates nor ends up there. So, since NRDC and the Sierra Club designed these maps, in part, to help them strategize where to focus their efforts, this per-capita map is of limited value.
This chart is where it starts getting good. It shows the counties with the highest total gasoline usage and ranks them by per-capita gas usage, showing where there are a whole lot of people using a whole lot of gas:
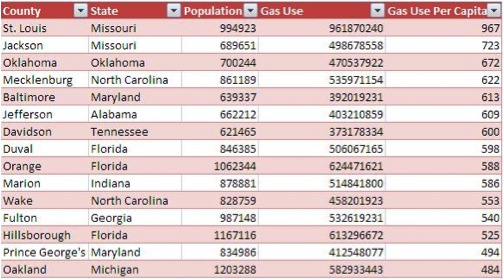
It goes on like this, giving a sense of where there are large concentrations of people who are all over-consuming gasoline. Keeping in mind that Lovaas is skeptical of the Missouri data, it goes from 672 gallons per person per year in Oklahoma to 192 per year in Los Angeles. The value of this comparison is clear when you realize that the initial map should L.A. looking like the real problem in terms of total usage, consuming 1.9 billion gallons of gasoline a year, while the new chart shows far more urgent needs elsewhere in the country.
In some places, those needs are being addressed. Mecklenberg County, North Carolina may see its numbers drop as a result of increased use of its new light rail system and, especially, Charlotte’s wisdom in concentrating development along those new transit corridors. What has long been derided as an unwalkable city is finding its legs.
Oklahoma City’s mayor, Mick Cornett, has started an active transportation revolution in the country’s fattest city, building walking paths, bike lanes and a streetcar line.
Meanwhile, Hillsborough County, Florida, lost an opportunity two years ago to mend their gas-guzzling ways. In a year when 77 percent of ballot initiatives to support transit were approved, Hillsborough residents went their own way, voting to defeat a one-cent sales tax for transportation. Seventy-five percent of that money would have gone to public transportation.
Meanwhile, Oakland, Michigan, two down from Hillsborough on NRDC’s list, voted 80 percent to 20 percent this August to support suburban transit with their property taxes.
It’s good to see so many of these counties taking steps in the right direction. NRDC’s new resource identifies them as hot spots for the country’s oil addiction, and they’re exactly the places that should be building bike lanes and improving transit.

Tanya Snyder became Streetsblog’s Capitol Hill editor in September 2010 after covering Congress for Pacifica and public radio. She lives car-free in a transit-oriented and bike-friendly neighborhood of Washington, DC.

Streetsblog has migrated to a new comment system. New commenters can register directly in the comments section of any article. Returning commenters: your previous comments and display name have been preserved, but you'll need to reclaim your account by clicking "Forgot your password?" on the sign-in form, entering your email, and following the verification link to set a new password — this is required because passwords could not be carried over during the migration. For questions, contact tips@streetsblog.org.