Tailpipe Emissions Account for Around 40 Percent of L.A. County Greenhouse Gas Emissions

Many Streetsblog readers are aware that driving generates a great deal of greenhouse gas emissions. Based on data compiled by Metro, Streetsblog was able to clarify just how much driving contributes to L.A. County GHG emissions. Sadly, as other sectors make some progress on reducing GHG, the percentage of county emissions coming from driving appears to be increasing.
This post will move from the federal level, to the state, down to the county and city. The charts and figures are pretty wonky, but the issue could hardly be more important. The methodologies and numbers are slightly different, but they all show extraordinarily harm coming from the Transportation Sector, primarily from too many people driving cars.
United States GHG Emissions
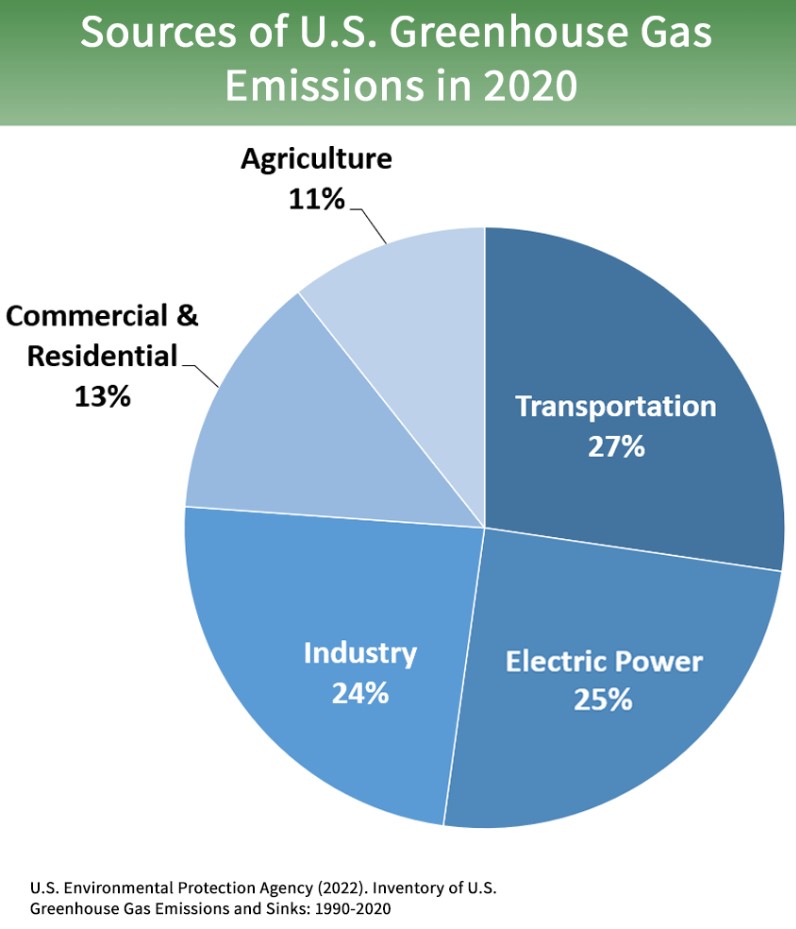
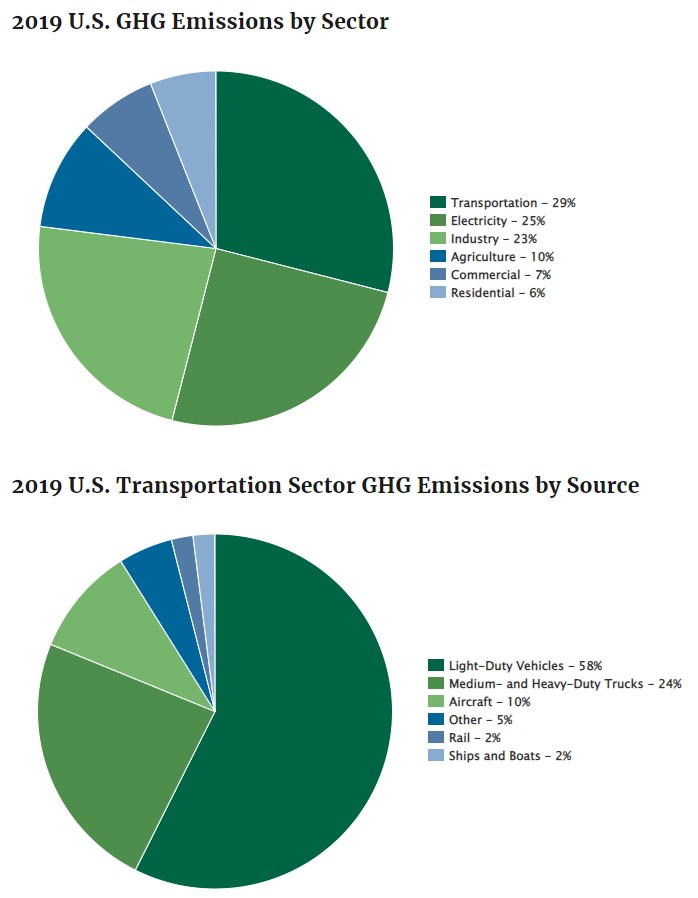
According to the federal Environmental Protection Agency GHG emissions inventory, the Transportation Sector is the largest source of U.S. GHG emissions.
Within the Transportation Sector, tailpipe emissions are by far the largest component; they consistently total 82-84 percent of transportation emissions. The biggest part of that is the cars that Americans use to get around daily: “light-duty vehicles” which include Passenger Cars (~41 percent) and Light-Duty Trucks (~18 percent). Additional tailpipe emissions include commercial trucks (~24 percent), buses (~1 percent), and motorcycles (0.2 percent). Those percentages are calculated from the EPA’s latest GHG inventory report.
Nationally, tailpipe emissions amount to about 22-23 percent of overall U.S. emissions (83 percent of 27 percent).
California GHG Emissions
Similar to the nation, in California the Transportation Sector is the largest contributor to GHG emissions statewide.
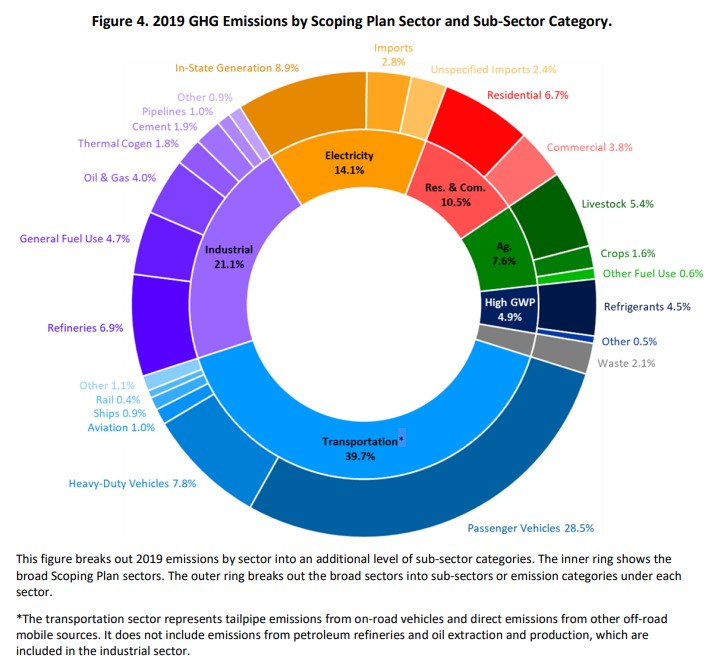
The Transportation Sector (blue in chart above) accounts for 39.7 percent of overall state emissions. In 2019, tailpipe emissions (cars and trucks) comprised 91.4 percent of the Transportation Sector, and account for more than a third (36.3 percent) of overall CA emissions. Note also that these figures undercount the life cycle impacts of driving. Transportation Sector emissions don’t include the state’s refineries (6.9 percent) and oil extraction/production (oil and gas together are 4 percent), which are included in the Industrial Sector. The CARB report notes that “When emissions from extracting, refining and moving transportation fuels in California are included, transportation is responsible for over 50 percent of statewide emissions in 2019.”
The inventory report shows that the Transportation Sector has been the largest percentage of CA GHG emissions for the past two decades.
Within the Transportation Sector, the overwhelming majority of GHG emissions are from tailpipes. Over the past two decades, the state found that “Emissions from gasoline used in on-road passenger cars, trucks, and SUVs are 78 percent of the transportation inventory and had been the main driver of the increases between 2013 and 2017.” For 2019 the percentage grew: tailpipe emissions worsened to 91.4 percent of the Transportation Sector – with 72 percent from passenger vehicles, and 20 percent from heavy duty vehicles (trucking).
The CARB report notes needed small gains from various fuels (biodiesel, renewable diesel, ethanol, fuel efficiency, battery electric vehicles, hydrogen fuel cell vehicles, and plug-in hybrid vehicles), but these were insufficient to significantly decrease GHGs from driving.
For the state, tailpipe emissions amount to about 36-37 percent of overall California emissions (91 percent of 40 percent).
Los Angeles County GHG Emissions
The local picture is a little less clear. There are various ways to measure GHG emissions – from municipal operations, from overall municipality-wide, and from even broader life cycle emissions. This post relies on analysis from Metro, L.A. County and L.A. City; each of these uses slightly different methodology.
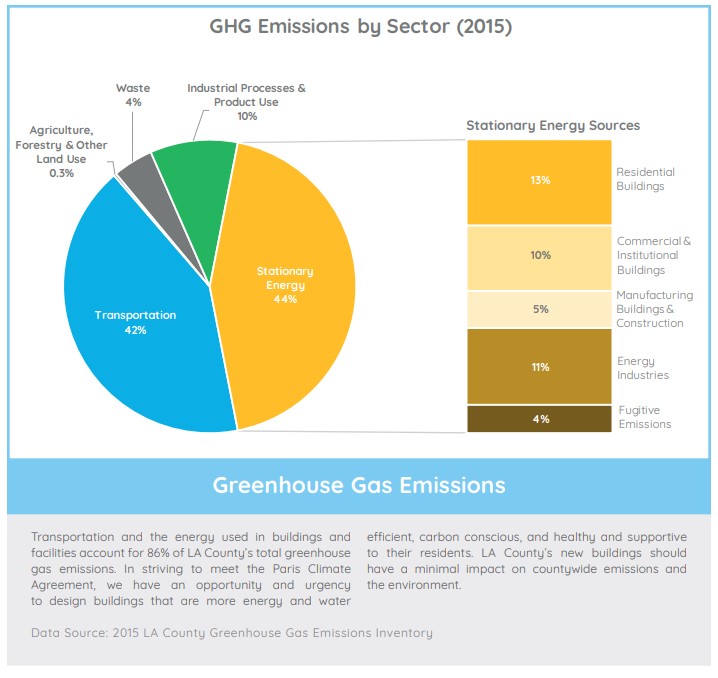
The county inventoried greenhouse gases as part of its 2019 Countywide Sustainability Plan. Based on 2015 data, the Transportation Sector accounted for 42 percent of GHG emissions.
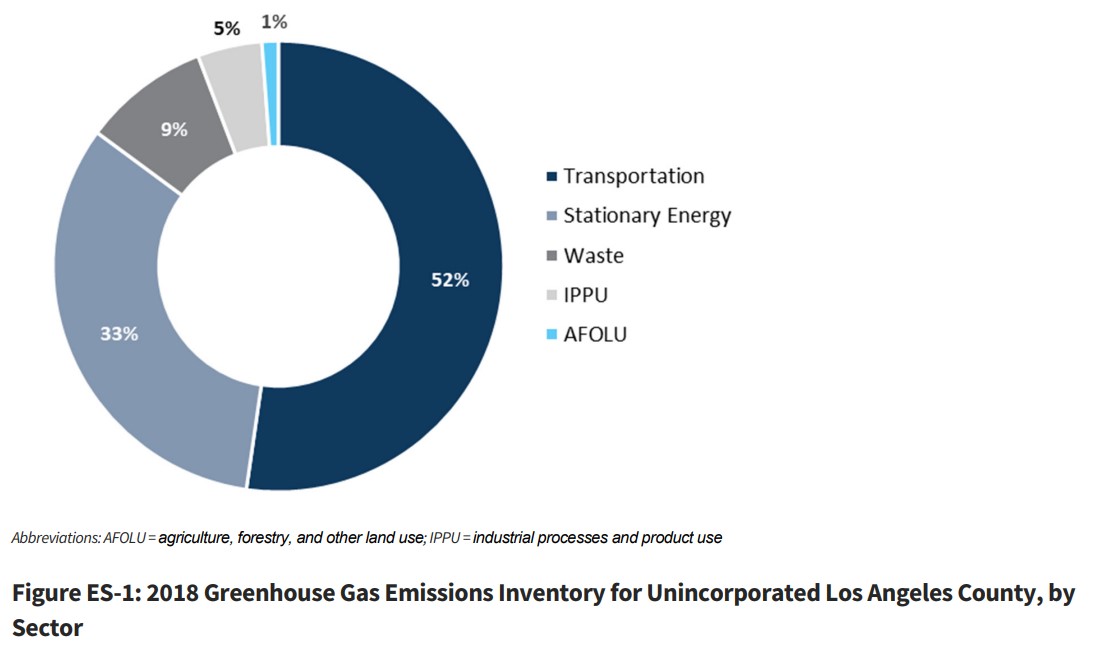
The county updated their plan in 2022, but, based on 2018 data, charted emissions for only unincorporated areas, where the Transportation Sector generated 52 percent of GHG emissions.
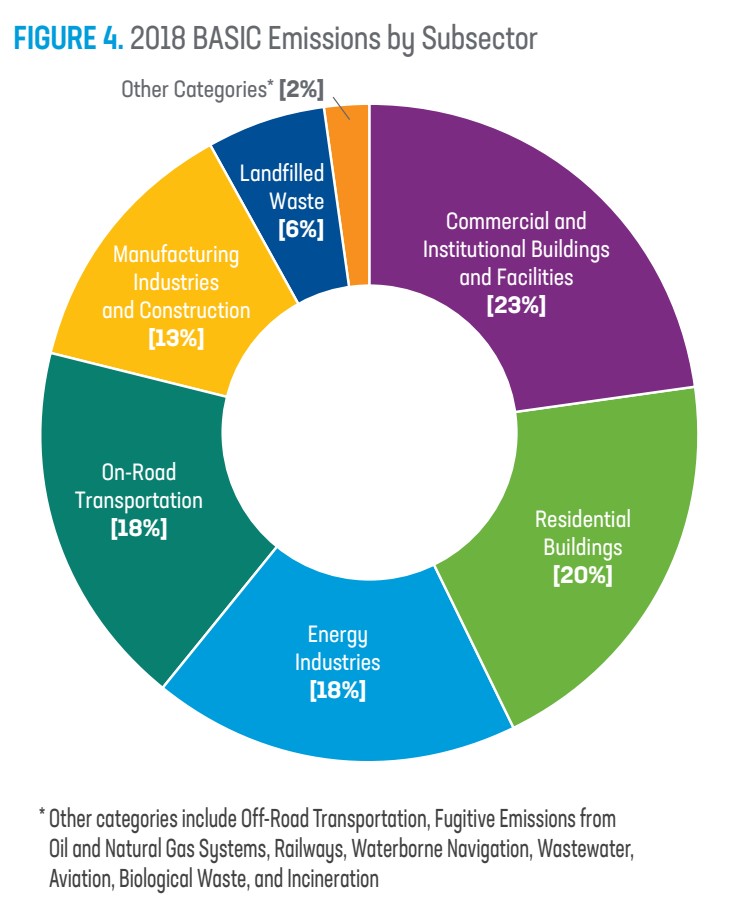
The city of Los Angeles used a slightly different methodology in its 2021 Community GHG Emissions Inventory report. Using 2018 data, that report found that on-road transportation accounted for 18 percent of overall L.A. emissions. Other Transportation Sector emissions – ie: aviation and shipping – were touched on in the report, but not included as transportation in the chart below.
Last August, Metro evaluated its freeway, transit, and active transportation investments and their impacts on emissions. As Streetsblog reported at the time, Metro found that increased driving from Metro freeway expansion projects more than offsets all the anticipated emission gains from bus, rail, bike and walk expenditures.
Metro’s staff report, presentation and Climate Emissions Analysis report cite many of the figures noted above. Using Transportation Sector emissions at the state (40 percent to “over 50 percent” when including refining, etc.) and county (52 percent), and the state figure for tailpipe emissions (78 percent), L.A. County tailpipe emissions total about 35-41 percent of countywide GHG emissions.
Summarizing, tailpipe pollution is roughly:
- 22-23 percent of United States GHG emissions
- 36-37 percent of California GHG emissions
- 35-41 percent of L.A. County GHG emissions
What accounts for the differences? That’s another story, but it may have to do with driving in comparison to other energy uses – like heating buildings in colder climates.
What the figures do show is that, if Southern California really wants to address its past and current contributions to the planet’s climate emergency, getting Angelenos out of their cars needs to be a major part of any suite of solutions.

Streetsblog has migrated to a new comment system. New commenters can register directly in the comments section of any article. Returning commenters: your previous comments and display name have been preserved, but you'll need to reclaim your account by clicking "Forgot your password?" on the sign-in form, entering your email, and following the verification link to set a new password — this is required because passwords could not be carried over during the migration. For questions, contact tips@streetsblog.org.