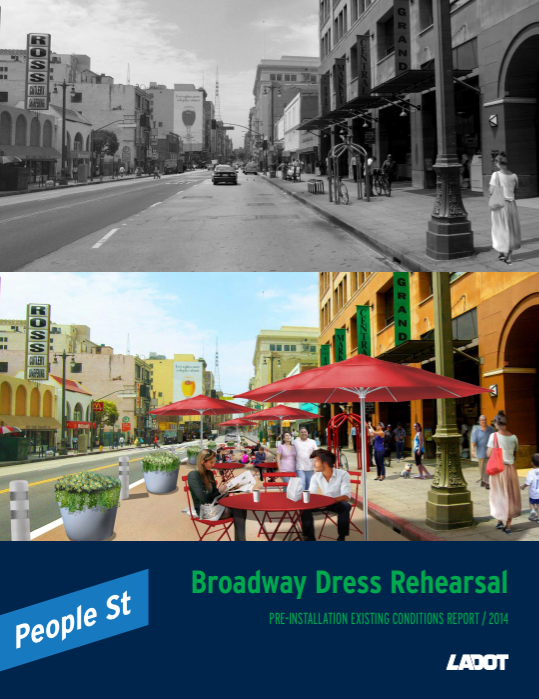
Yesterday, the Los Angeles City Transportation Department (LADOT) released a new report entitled Broadway Dress Rehearsal: Pre-Installation Existing Conditions Report 2014 [PDF]. The handsome 82-page report is full of facts, figures and graphs all detailing the "safety, public life, and economic" conditions on Broadway from 2nd Street to 11th Street in downtown Los Angeles. This stretch of street is where the Broadway Dress Rehearsal project was recently completed. The streetscape project removed a traffic lane to make space for plazas which feature outdoor seating and planters.
LADOT's announcement states that the Broadway report is the first one to use the department's new "robust methodology for pre- and post-installation evaluation and data collection." This evaluation process is outlined in a second report entitled Project Evaluation Manual V1.1 [PDF]. LADOT further states, "By using established metrics that illuminate how new public spaces and street design impact the life of the street, we can track trends over time, evaluate project performance, and inform future program direction."
LADOT plans to do a corresponding post-installation study in Fall 2015 to compare the conditions before and after the Broadway Dress Rehearsal.
The reports are from LADOT's innovative People St shop, the folks who are oversee the city's new plaza, parklet, and bike corral programs.
What does the report say about Broadway? Here are some highlights from LADOT's announcement:
Pedestrians generally outnumber vehicles on Broadway. There were more people walking along Broadway over the course of just 6 hours than motor vehicles traveling along the corridor over a 24-hour period on the same weekend day.
From 2007 to 2012, 120 intersection and 94 mid-block injury collisions were reported along Broadway (involving people driving, walking, and bicycling).
Pedestrian and bicycle injury collisions have been increasing.
Most mid-block collisions were caused by unsafe lane changes and unsafe speed by drivers.
Vehicular speeds and volumes differ for northbound vs. southbound traffic. Traffic speeds were higher and volumes lower going southbound; traffic speeds were lower and volumes higher northbound.
Excessive driver speeding behavior was observed. Almost one-quarter of drivers were speeding while heading south on Broadway on the weekday studied.
The report is chock-full of great visuals, breaking down all sorts of data, even differentiating the east and west sides of Broadway. There is information on motorists yielding, motorist encroachment on crosswalks, bike and pedestrian counts, speeding, collisions, spending, tax revenue, and even pedestrian group size and posture (standing vs. sitting).
Below are some sample data visualizations:
![Counts of people walking and bicycling on Broadway. From Broadway Dress Rehearsal report [PDF]](https://lede-admin.la.streetsblog.org/wp-content/uploads/sites/50/2014/11/PedBikeBroadway.png?w=636)
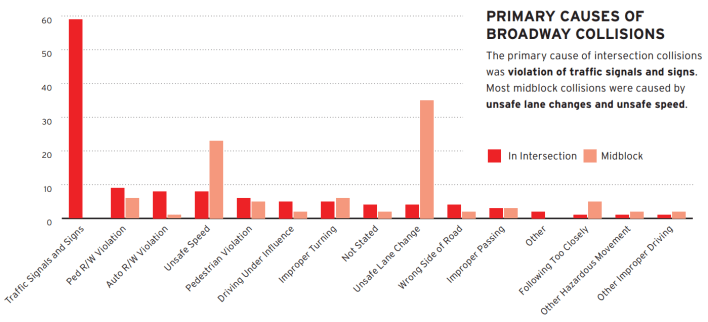
![Car-involved collisions trending downward, while pedestrian and bike increase. Chart from Broadway Dress Rehearsal Report [PDF]](https://lede-admin.la.streetsblog.org/wp-content/uploads/sites/50/2014/11/BroadwayCollisionsGraph.png?w=628)
Overall, the Broadway conditions report is a fascinating read.
Broadway is among Los Angeles' most pedestrian-trafficked streets. It is also among L.A.'s best urban form, supporting thriving retail in its historic luxury heyday and, for decades, as the foremost retail corridor serving many L.A. Latino populations, predominantly immigrant and working class. Today's Broadway supports an uneasy mix; it mostly retains its working class character, while more upscale downtown gentrification has begun to make inroads.
The pre-installation report shows Broadway's pedestrian character, and establishes a needed baseline for evaluating projects and trends over time. Many changes will be the result of city projects, including Bringing Back Broadway, but as the above graph indicates, travel behavior was already changing on Broadway. Broader trends, including gentrification, new technologies, declining driving, and increasing active transportation, may make it difficult to isolate the impacts of LADOT projects.
The report heralds a welcome and thorough data-driven approach that has been championed by LADOT General Manager Seleta Reynolds, Mayor Eric Garcetti, and has been outlined in the most recent draft of the city's Mobility Plan. Let's hope that the city applies these sorts of thorough evaluations to all of its transportation projects, from bridge replacements, to road widening, to speed limit increases, even to peak-hour parking restrictions.
As data like this is collected and distributed, the city needs to go beyond the PDF format and make its data open and accessible. PDFs are very difficult to extract data from. Open data advocates call for information to be released in "machine-readable" format like a spreadsheet or database. This way anyone -- journalists, researchers, app developers, or the concerned public -- could analyze the data in ways that the city may not have anticipated or been able to afford. Ideally, the city would publish PDF reports like these, and also make the underlying data accessible via some kind of open data portal, similar to those built in NYC or Chicago.
SBLA looks forward to the post-installation figures.
