Let the Debate Begin: NYC, SF Snag Top Spots in First Transit Score Rankings. L.A. 11th
Today, Walk Score -- developer of the popular method for evaluating neighborhood walkability (and filling out NCAA tournament brackets) -- announced its first ranking of cities by Transit Score, a measure of the "usefulness" of a city's transit system. On a 100-point scale, New York and San Francisco took the top two spots with scores of 81 and 80 respectively, while Boston (74), Washington D.C. (69), and Philadelphia (68) round out the top five (see the full rankings).
Walk Score CEO Josh Herst believes this is an important time to begin evaluating cities in terms of transit, and all the Americans who rode transit 10.4 billion times in 2011 would likely agree with him. "Heading to the gas pump this season is about as much fun as getting a root canal," Herst said in the official release [PDF]. "With gas prices expected to hit new highs, more people are riding transit, walking and biking to save money. And being able to leave your car at home more often is great for your wallet, your waistline and the environment.”
The company generates Transit Scores using data provided by transit agencies, and takes into account the number of nearby transit routes (weighted differently by mode), how often those routes run, and how far away the stations are from any given point. A city's score is based on a population-weighted average of all individual point scores. For an excellent discussion of the Transit Score methodology, check out this exchange between transit expert Jarrett Walker and Walk Score's Matt Lerner from early 2011.
Overall, it's fair to say that few American cities score well on the system. Of the 25 largest cities that make their transit data available to the public, only ten topped a Transit Score of 50, which is the lowest score qualifying as "good transit," described as "many transit options nearby." Most (14) fall into the "some transit" bracket, and the 25th-highest Transit Score among the cities evaluated -- Raleigh, NC -- is a 23, the upper end of "minimal transit."
The scale is non-linear; that is, raising a city's Transit Score from 70 to 80 would take much more work than raising it from 60 to 70. Because of the population weighting, the more people who live in a city, the harder it is to raise the score: As the Walk Score website explains, one additional bus route means a lot more for a small town than it would for a big city.
Furthermore, rail transit (including subways and light rail) is weighted at twice the value of a bus route, with ferries, cable cars, and other modes splitting the difference between the two. These numbers weren't pulled out of thin air -- they reflect research that shows a range of effects of different transit modes on the value of surrounding land.
Because of this, Transit Scores will tend to be higher in the center of cities where multiple rail lines converge, but where residential population may not be at its densest. It's not hard to see how development near rail stations could make or break a city's Transit Score.
No doubt, Transit Score is a useful way to compare different neighborhoods within a city, and now entire cities as a whole. However, it primarily reflects how easy it is to get to transit, rather than where you can go and what you can do with transit once you're on it.
Stay in touch
Sign up for our free newsletter
More from Streetsblog Los Angeles
LAPD Was Crossing Against Red Light in Crash that Killed Pedestrian and Injured Six in Hollywood
The department says the officers had turned on their lights and sirens just before crossing, but won't say why they did so.


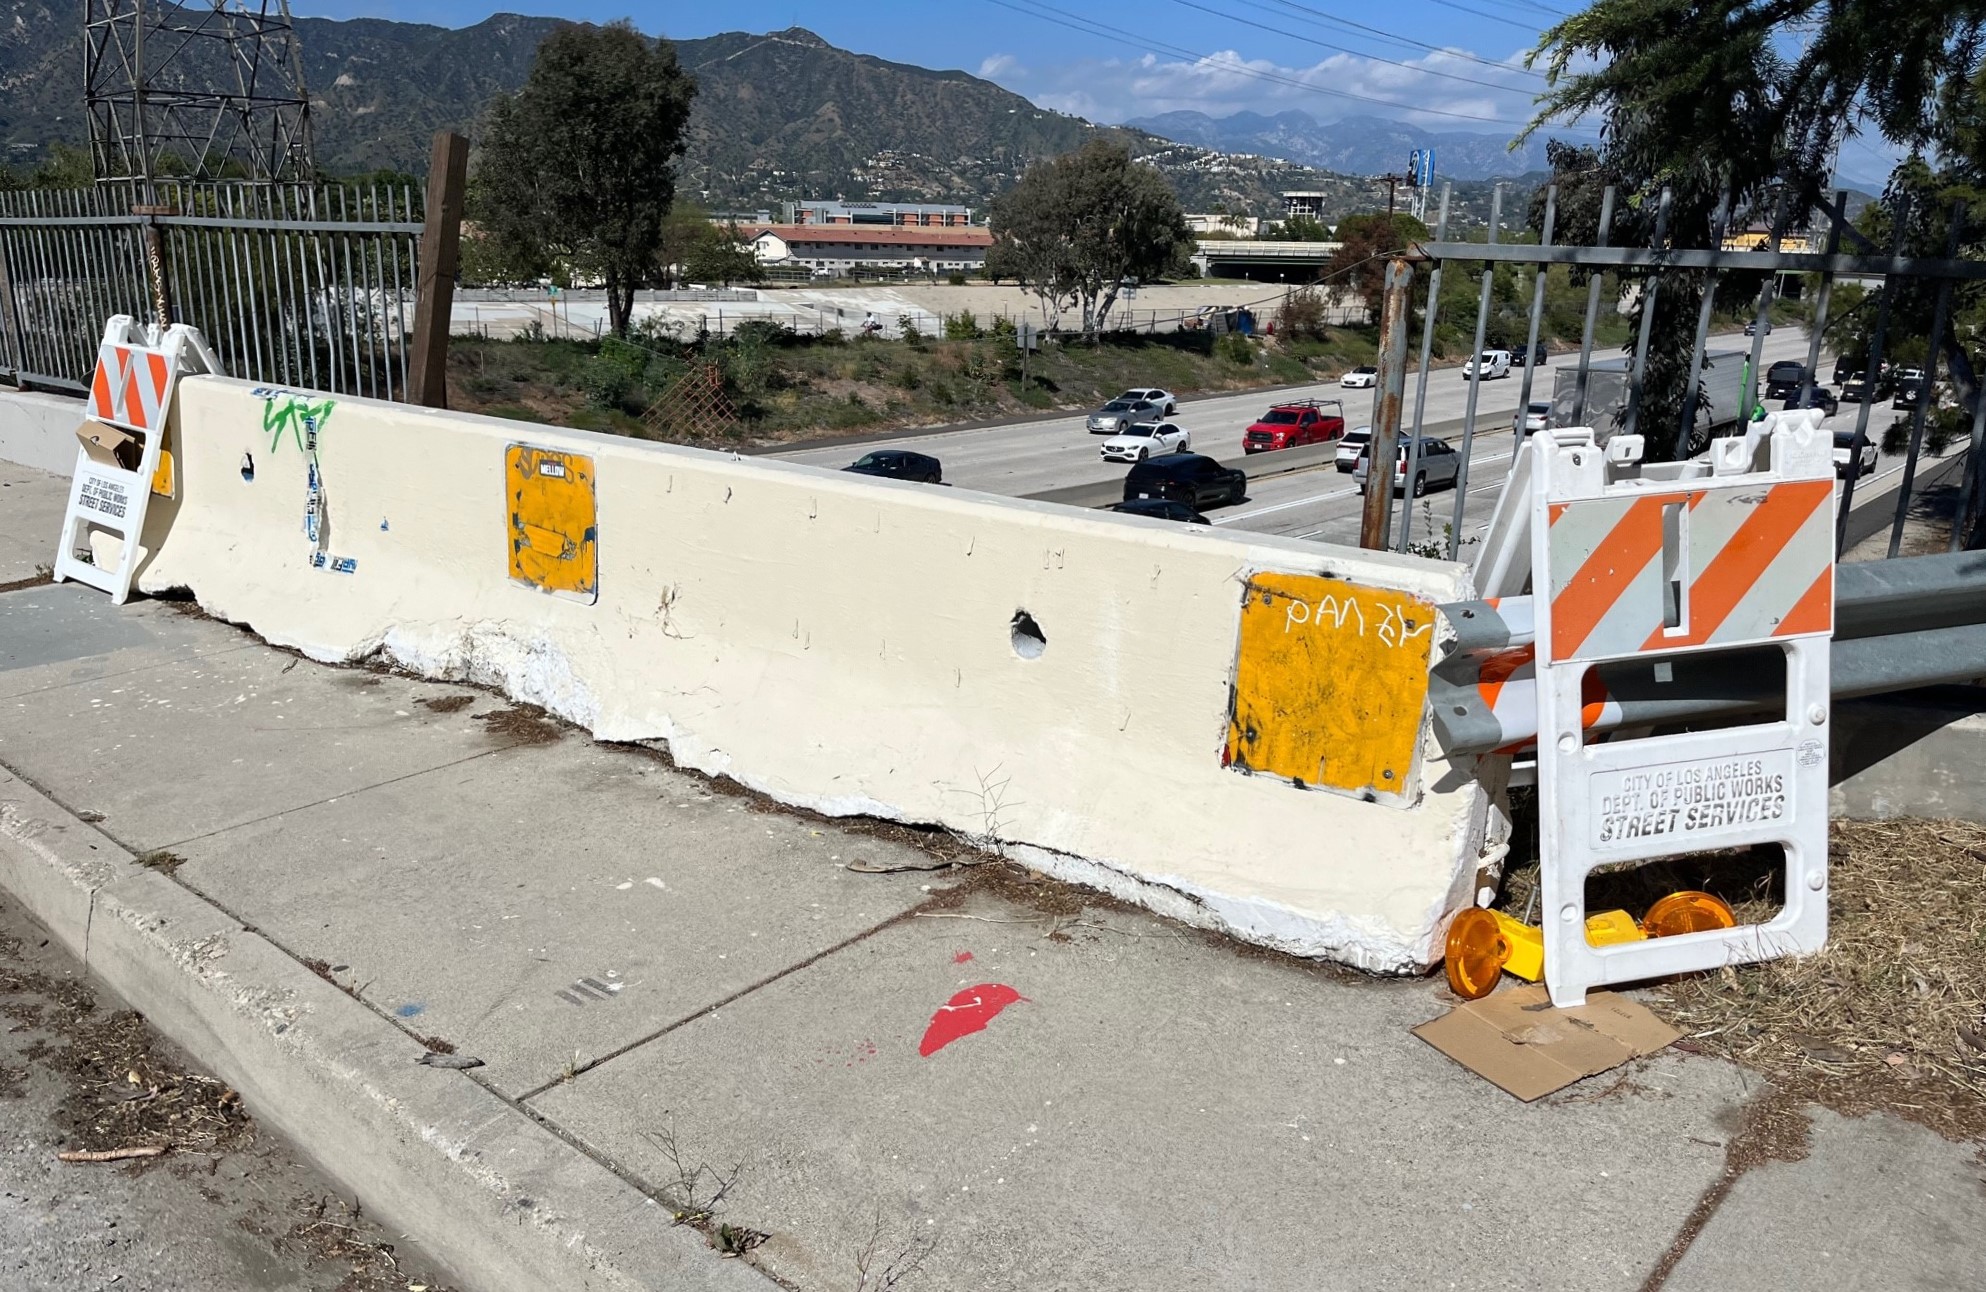
Freeway Drivers Keep Slamming into Bridge Railing in Griffith Park
Drivers keep smashing the Riverside Drive Bridge railing - plus a few other Griffith Park bike/walk updates