Fun Facts on How Much People Drive In Different Parts of Southern California and L.A.
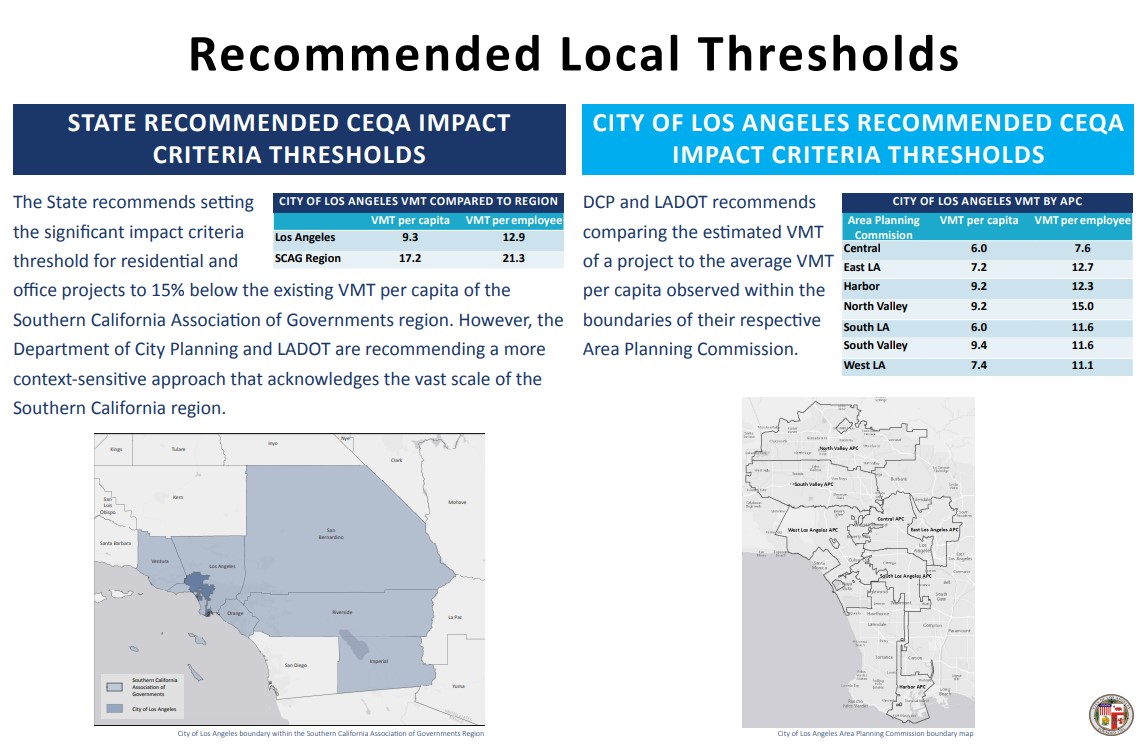
Full page of City Planning presentation on Vehicle Miles Traveled – all images via DCP presentation
Here are some interesting tidbits from an L.A. City presentation on the wonky LOS/VMT stuff that SBLA reported on recently. These 2018 figures are not news, but the statistics show that people really do drive less in central, transit-rich areas.
Above is the full slide, taken from a 2018 City Planning Department presentation. Below, Streetsblog will walk readers through individual maps and charts. "VMT" is vehicle miles traveled.
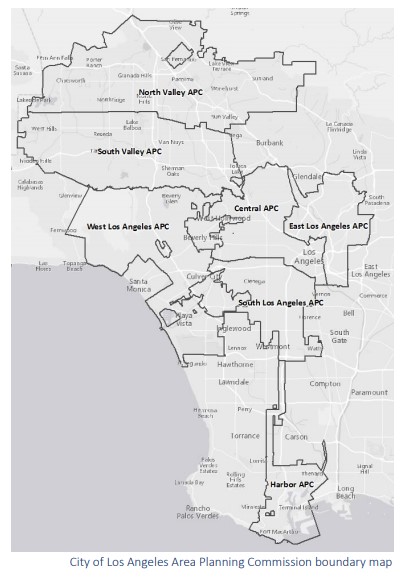
Geographically speaking, L.A. City is a relatively small part of the six-county Southern California Association of Governments (SCAG) region.
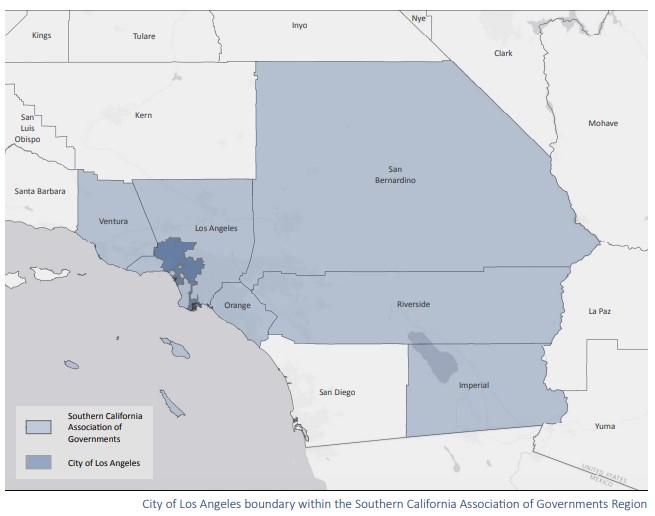
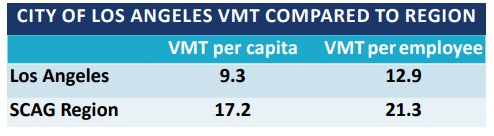
On an average weekday, people in Los Angeles City drive 9.3 miles, which is about half (actually 54%) of the Southern California regional average of 17.2 miles. On a weekday, an employee working in L.A. City drives on average 12.9 miles, which is about 60% of the Southern California regional average of 21.3 miles.
The L.A. City Planning Department (LADCP) breaks the city up into seven areas, called Area Planning Commissions or APCs.
Driving behavior is different in different parts of the city. Below are the city's VMT targets for various parts (APCs - Area Planning Commissions):
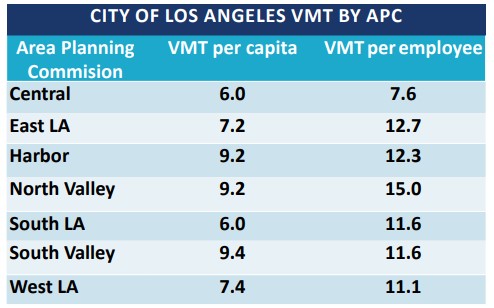
These numbers are slightly different than the city/regional chart above; they are targets are 15% below the APC average. So below are the calculated actual VMTS for L.A. APCs:
On average people living in the San Fernando Valley drive about 50% more than people living in Central or South Los Angeles. People who work downtown drive about half as much daily as folks who work in the North Valley.
At this grain, it is difficult to make much in the way of definitive statements. APCs are big places; the Hollywood Hills and Skid Row are in the same APC but don't share too much in the way of travel behavior.
For the most part, lower driving rates appear to correspond to transit dependency and poverty - though both the East L.A. and the West L.A. APCs buck that trend somewhat.
It is difficult to tell how much transit/bike/walk usage factors into these measurements. It is clear that core areas see less driving, but some (including some SCAG planners) suggest that this may be mostly a result of driving distances. Some assert that, all over L.A., nearly everybody drives - but in central places, the distances driven are generally shorter. In the middle of L.A., many residents might drive something like 2-4 miles to get to work, school, shopping, and other common destinations. In the more suburban parts of the city, residents might drive more like 4-10 miles to get to those similar destinations. The outlier that bucks this trend is the Central L.A. VMT per employee figure. A rich array of public transit options - buses, Metro rail, Metrolink - serves DTLA workers - and their lower commute drive miles seem to indicate many use transit.
Stay in touch
Sign up for our free newsletter
More from Streetsblog Los Angeles
Metro Board Funds Free Student Transit Pass Program through July 2025
Metro student free passes funded another year - plus other updates from today's Metro board meeting


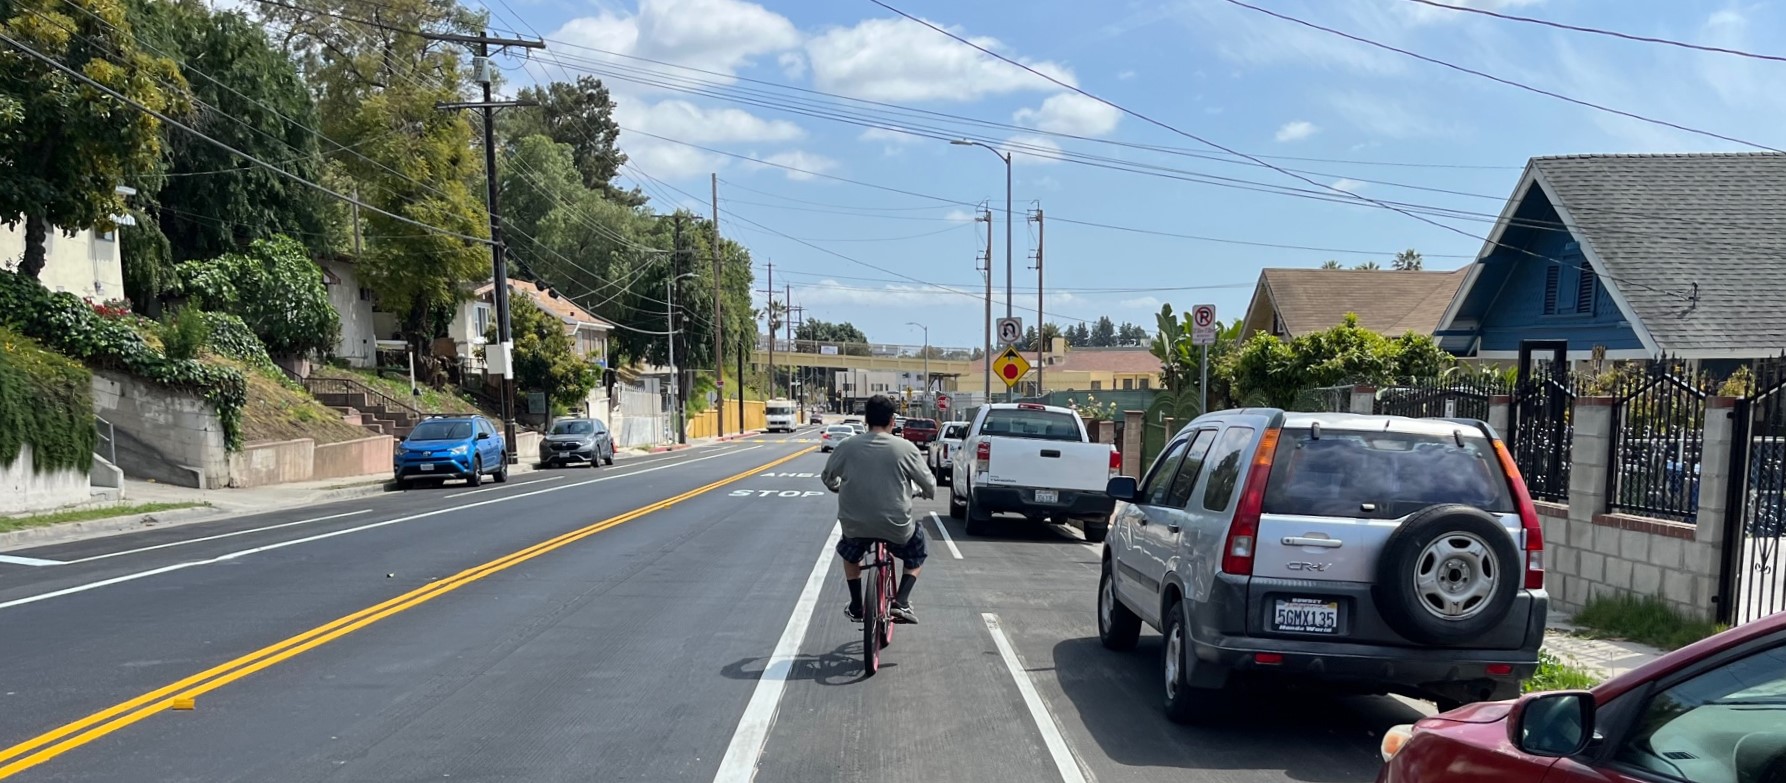
Eyes on the Street: New Lincoln Park Avenue Bike Lanes
The recently installed 1.25-mile long bikeway spans Lincoln Park Avenue, Flora Avenue, and Sierra Street - it's arguably the first new bike facility of the Measure HLA era