Earlier this week, SBLA attended UCLA's The Future of Public Transit conference. The one-day event was hosted by UCLA's Lewis Center and Institute of Transportation Studies. Numerous speakers spoke on the evolving landscape for public transit and broader mobility - from Houston to New York to Los Angeles. This article recaps two of the more informative and more academic presentations on trends impacting transit ridership. There are no major surprises gleaned for folks who read Streetsblog and who ride transit in Los Angeles, but it is interesting to see data quantified to back up trends observed.
Manville on Driving vs. Transit Ridership
Michael Manville, Assistant Professor of City and Regional Planning at Cornell University, spoke on how recent driving trends have impacted transit ridership. In 2005, driving in the U.S. leveled off. It subsequently declined through 2014. Though there has been a recent uptick, per-person driving is still below 2004 levels.
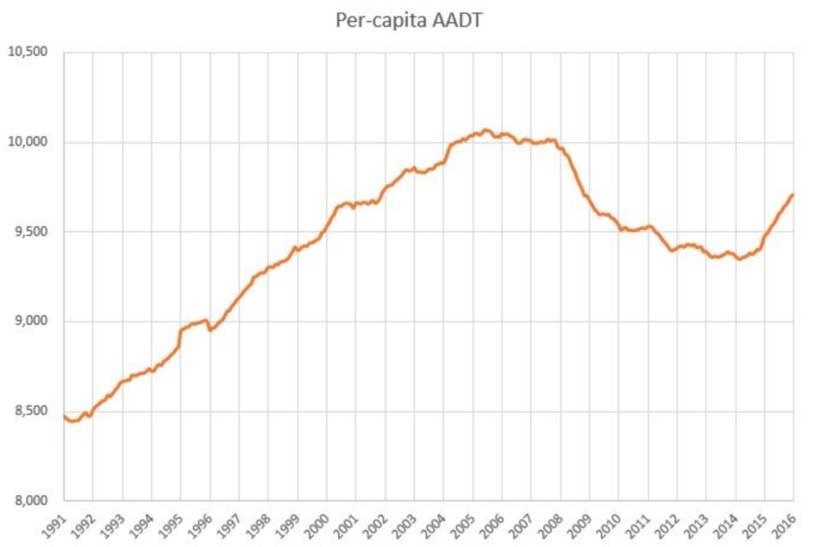
Does less driving mean more transit ridership? Manville's prognosis is "probably not."
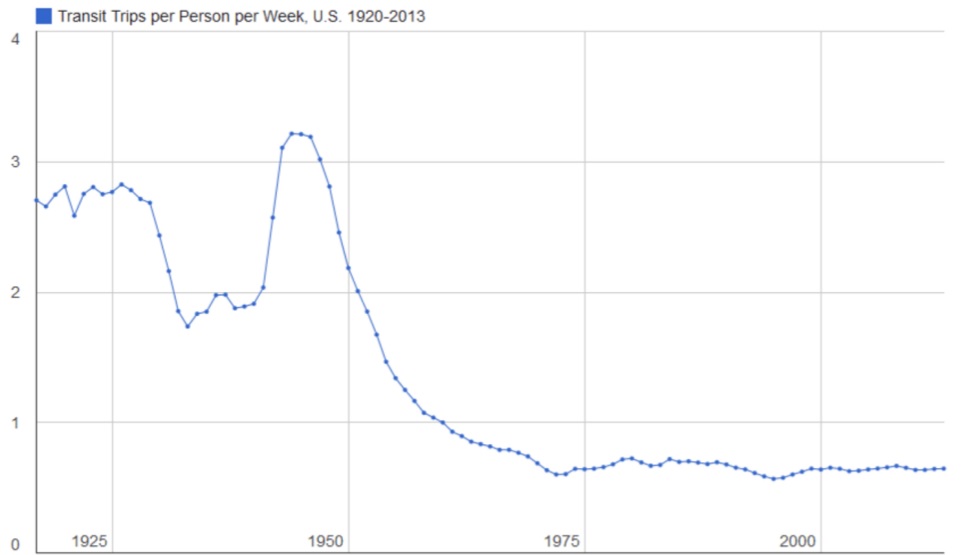
Manville pointed out that, despite overall U.S. transit service nearly tripling between 1970 and 2013, overall ridership has remained flat. In 1970, Americans took 0.68 trips per person per week. That number remains level over the following decades: 1980/0.72; 1990/0.68; 2000/0.64; 2004/0.64; and in 2013/0.65.
Per Manville, from 2004 through 2013, 77 urban areas experienced a decline in vehicle miles traveled (VMT). In those areas, only 36 saw a rise in transit usage. Further decoupling transit increases from driving declines, transit use rose by a greater amount in 13 other urban areas where driving did not decline. Manville cautions that overall transit ridership is very concentrated in a small number of areas. Greater New York City accounts for a third of U.S. transit ridership. Sixty percent of transit ridership is concentrated in just five urban areas: NYC, L.A., Chicago, Washington D.C., and S.F.
Manville went on to explore the transit ridership effects of voter-approved transportation funding measures, like Metro's Measure R and probable follow-up this year. The impact on transit ridership is not much. Though voters are increasingly willing to vote for transit funding, much like an ironic Onion headline, they do not see the new transit as something they would personally ride. Winning one-time support for funding transit is much easier than ongoing efforts aimed at behavioral change. To some extent, driving voters feel they have "done their part" just by voting in favor of transit.
If funding transit is not effective for growing ridership, what is? Manville says one effective solution is making driving more expensive, such as increasing the gas tax or tolling for road use.
Blumenberg on Transit Ridership Trends for Immigrants and Youth
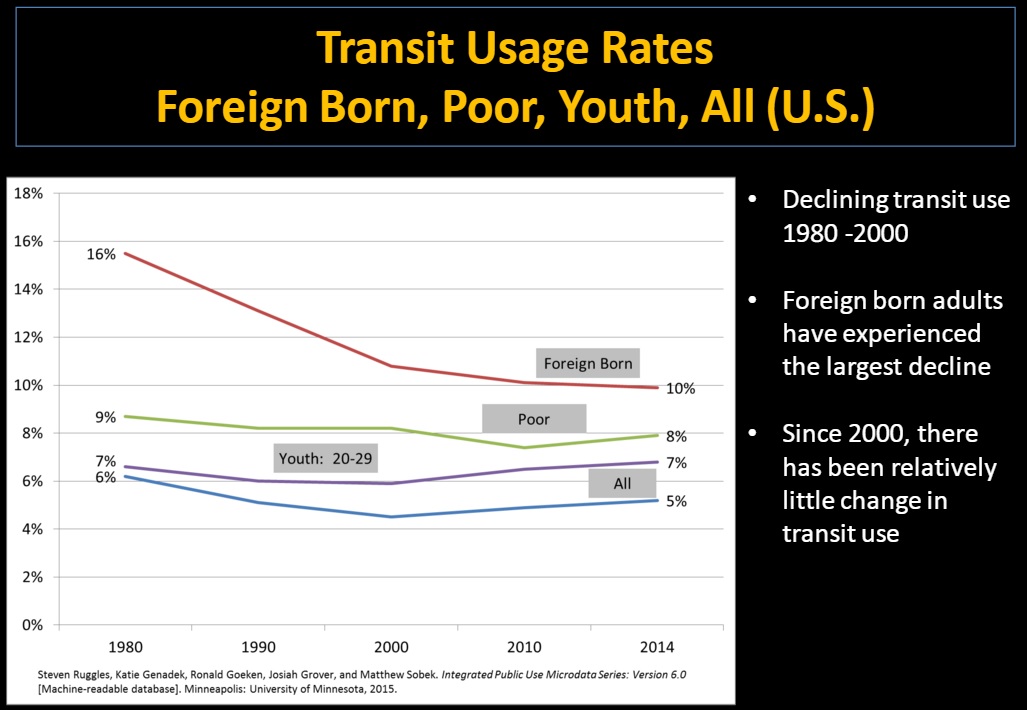
Evelyn Blumenberg, Professor and Chair, Department of Urban Planning, UCLA Luskin School of Public Affairs, spoke on transit ridership trends among youth and immigrants. Blumenberg clarified that data presented was based on commuting as reported in the U.S. Census American Community Survey, which can under-represent low income residents.
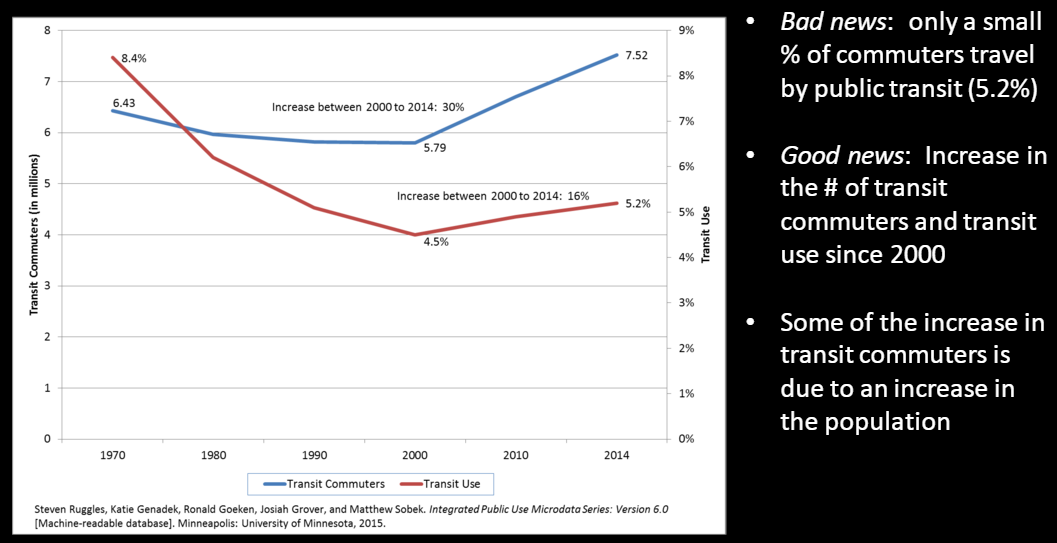
Overall, for the U.S., 5.2 percent of commuters get to work via public transit.
The following groups commute via transit more than the general population: recent immigrants, African Americans, foreign born, the poor, Latinos, and young adults.
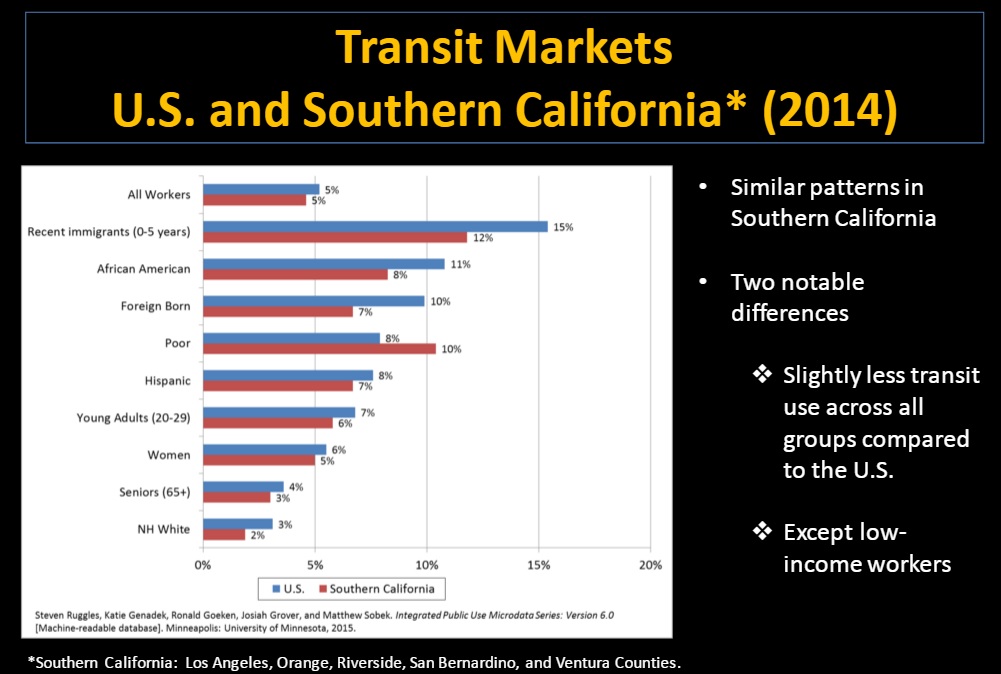
National trends hold true for Southern California, though, for most categories, transit usage is slightly less than the overall U.S. usage. Even with comparatively low transit usage, the five-county Southern California area is so populous that it represents five percent of U.S. transit commuting.
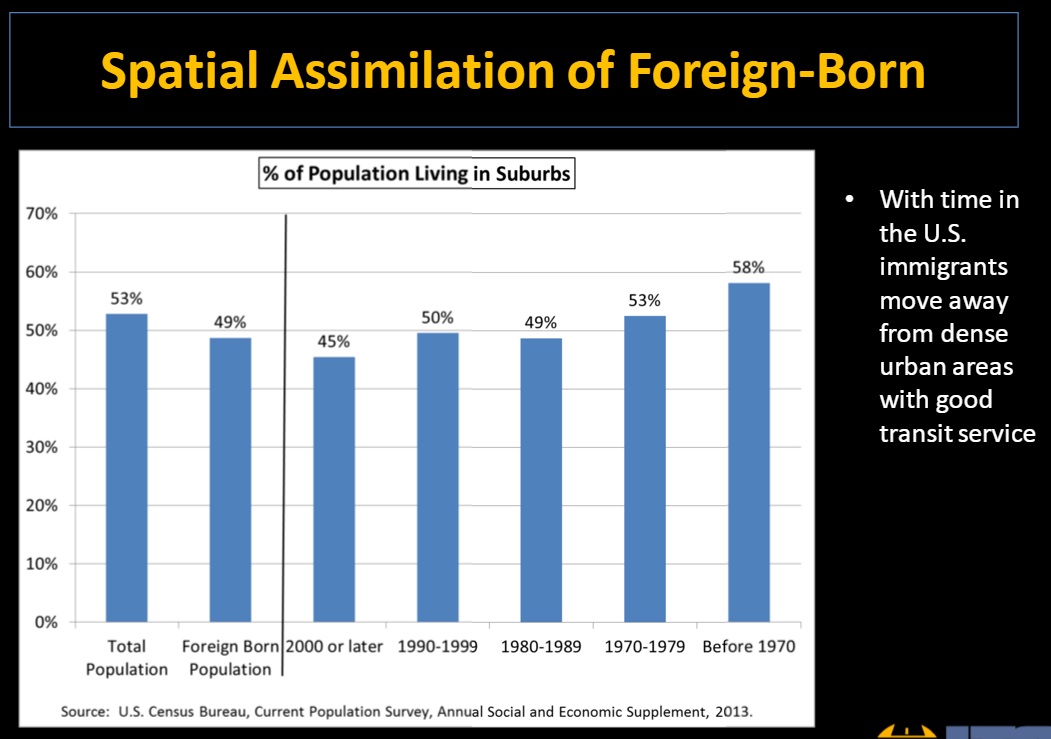
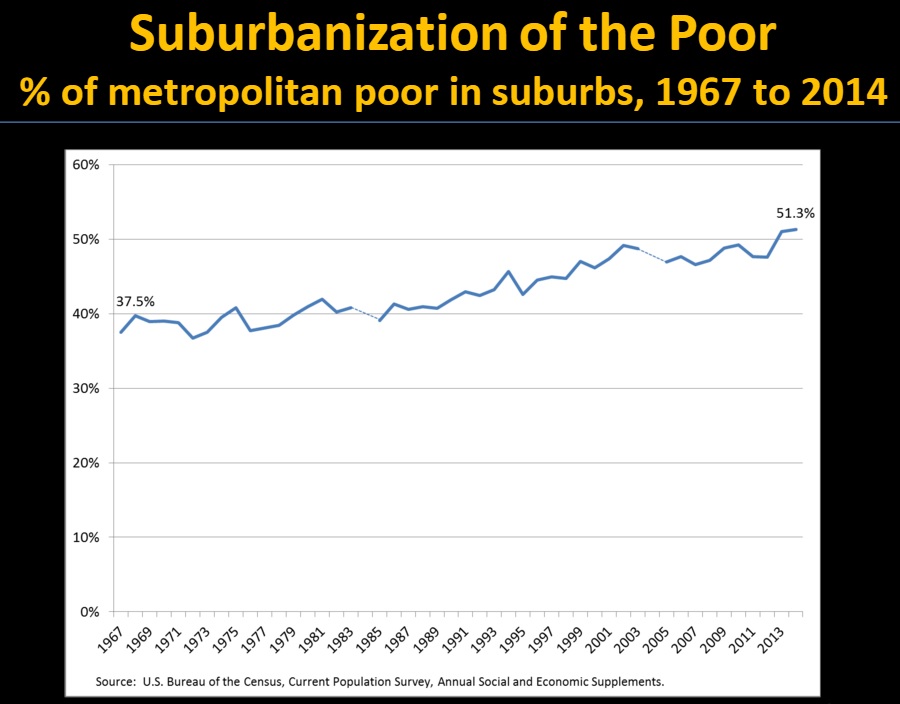
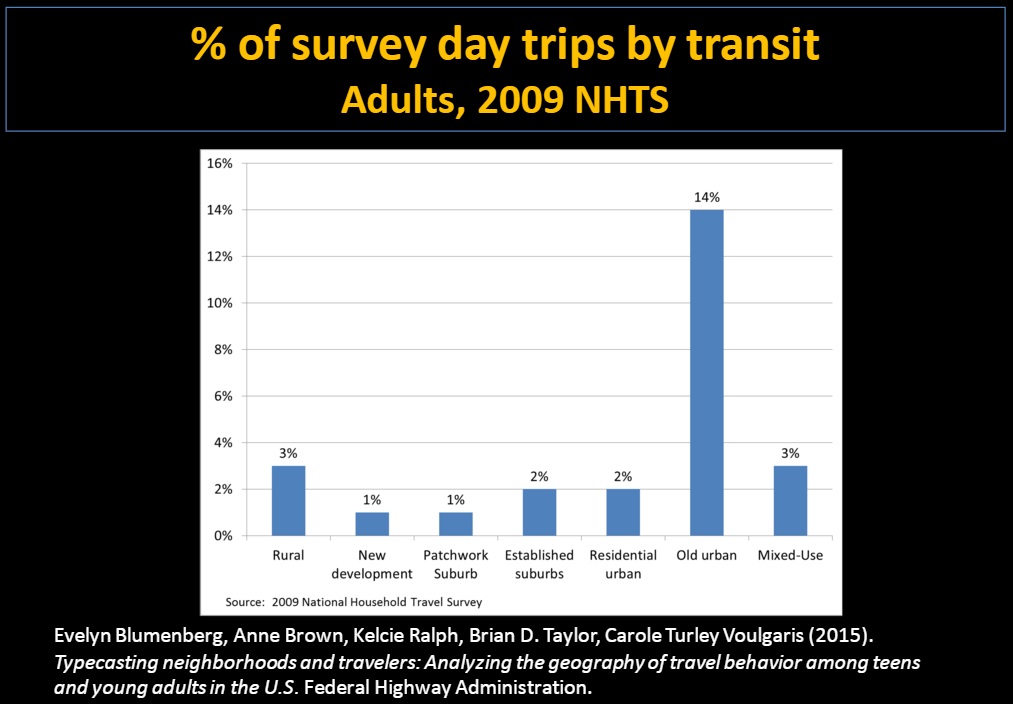
Transit works best in dense areas where home and work are fairly close together. Transit agencies have a difficult time serving the needs of residents of suburban areas. Two groups that have shown high levels of transit ridership - immigrants and the poor - are living more in the suburbs, leading to decreased transit use.
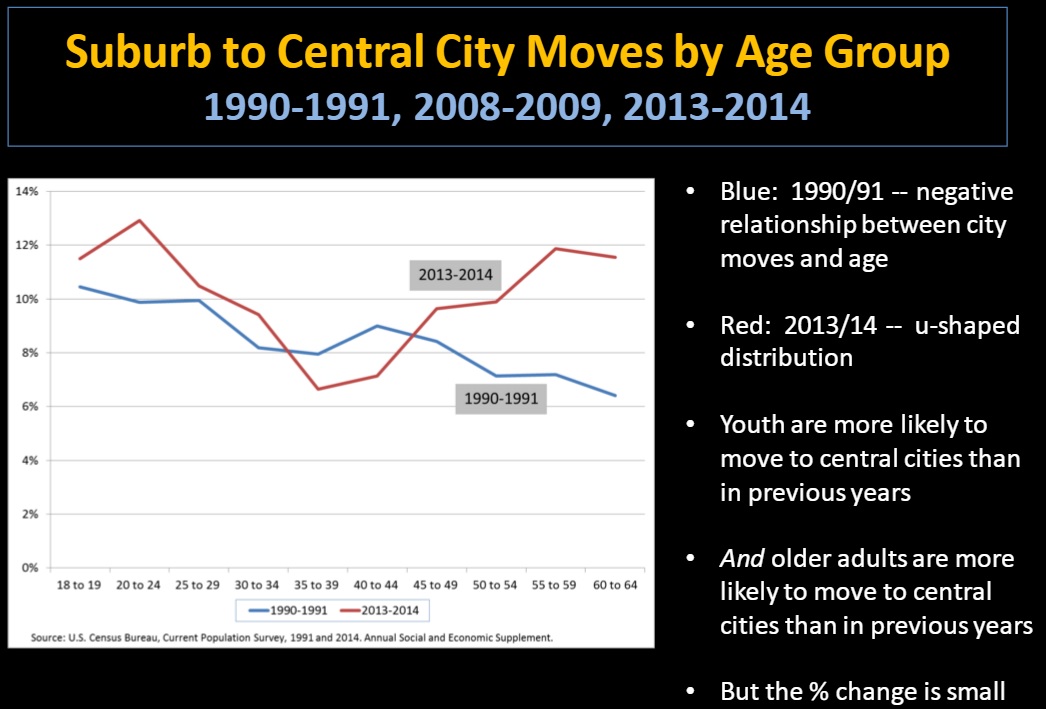
The transit renewal story that urbanists like to tell is that the millenial generation is moving back into the city. According to Blumenberg, the data shows that there has been a small increase in the percentage of youth (and the percentage of older working age adults) moving from suburbs to central cities. Unfortunately, with limited exceptions, the increase is dwarfed by the growth in residents living in suburban neighborhoods.
With these trends, despite substantial transit investment, overall transit commuting has remained fairly constant. Blumenberg suggests that substantial transit investments may have stemmed further declines in transit use. (I would add, echoing Yonah Freemark, that the substantial public investment in transit infrastructure was made at the same time by even greater public and private investment in car infrastructure in the form of highways, roads, parking, etc.)
Overall, Blumenberg paints a somewhat challenging future for public transit. Transit agencies find it more and more difficult (and expensive) to serve dispersed populations traveling to increasingly dispersed workplaces. Blumenberg recommends major changes in land use, such as greater density in areas well-served by transit.
Thank you to Evelyn Blumenberg and Michael Manville for their informative presentations. Apologies if I have missed key points in trying to edit down your work.
Stay in touch
Sign up for our free newsletter
More from Streetsblog Los Angeles
Metro Looks to Approve Torrance C Line Extension Alignment
Selecting the relatviely low-cost hybrid alternative should help the oft-delayed South Bay C Line extension move a step closer to reality


This Week In Livable Streets
CicLAvia returns to Venice Boulevard, Metro board committees, L.A. City Council Transportation Committee, Metro budget theater, and more