For Long Beach and Los Angeles, What a Difference a Few Years Makes
"Los Angeles isn't Long Beach."
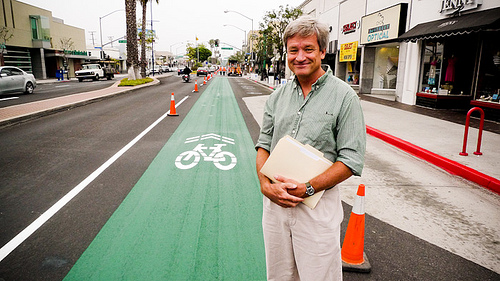
The previous sentence isn't just completely obvious, for years it was a common excuse as to why Los Angeles wasn't embracing bicycle and pedestrian friendly projects as quickly as its neighbor to the south. A recent report by the Alliance for Walking and Bicycling shows that as recently as 2009, the sustainable transportation gap between the two cities wasn't so great. After all, it was the summer of 2009 that Long Beach installed the green sharrowed bike lane in Belmont Shores, kicking off an impressive run of building progressive bicycle infrastructure and embracing other innovative programs such as the Bicycle Friendly Business Districts.
In 2009, a higher percentage of commuters were "people powered" in Los Angeles and the twenty year growth rate for bicycling was much hire in L.A. than in L.B. Meanwhile, Long Beach was lost over one quarter of its pedestrians, while L.A.'s pedestrian decline was in the mid single digits. Anecdotally speaking, Long Beach has probably reversed those numbers in the last two years.
As benchmark reports and other data come in future years, it will be interesting to see what gap, if any, opens between the two cities. In the meantime, a quick comparison of Long Beach and Los Angeles from the “Bicycling and Walking in the United States: 2012 Benchmarking Report.” Remember, all these numbers are from 2009.
Levels of Biking & Walking
Share of commuters who bike to work (pg. 45)
National average: 0.5%
Average among cities: 0.9%
- Long Beach: 1.0%
- Los Angeles: 0.9%
Share of commuters who walk to work (pg. 46-47)
National average: 2.9%
Average among cities: 4.9%
- Los Angeles: 3.5%
- Long Beach: 3.0%
Growth/decline in bicycle commuters ‘90-’09 (pg. 205-206)
(should compare to population growth/decline)
National average: 64%
Average among cities: 116%
- Los Angeles: 81%
- Long Beach: 13%
Growth/decline in pedestrian commuters ‘90-’09 (pg. 207-208)
(should compare to population growth/decline)
National average: -12%
Average among cities: 3%
- Los Angeles: -6%
- Long Beach: -26%
Percent of traffic fatalities that are bicyclists (page 57 & 59)
National average: 1.8%
Average among cities: 3.1%
- Long Beach: 4.1%
- Los Angeles: 2.4%
Percent of traffic fatalities that are pedestrians (page 56 & 62)
National average: 11.7%
Average among cities: 26.9%
- Los Angeles: 31.9%
- Long Beach: 30.9%
Bicyclist fatality rate (fatalities/10K bicyclists) (page 57 & 59)
National average: 4.2
Average among cities: 2.4
- Long Beach: 2.8
- Los Angeles: 1.9
Pedestrian fatality rate (fatalities/10K pedestrians) (page 56 & 62)
National average: 5.0
Average among cities: 4.0
- Long Beach: 7.2
- Los Angeles: 6.4
Percent of federal transportation dollars to biking and walking (page 86-87)
National average: 1.6%
Average among cities: 1.6%
- Long Beach: 0.9%
- Los Angeles: 0.6%
Per capita funding to biking and walking (page 86-87)
National average: $2.17
Average among cities: $1.80
- Long Beach: $1.48
- Los Angeles: $0.43
Percent of adults who are obese
National average: 27%
Average among cities: 25%
- Los Angeles: 26%
- Long Beach: 26%
Stay in touch
Sign up for our free newsletter
More from Streetsblog Los Angeles
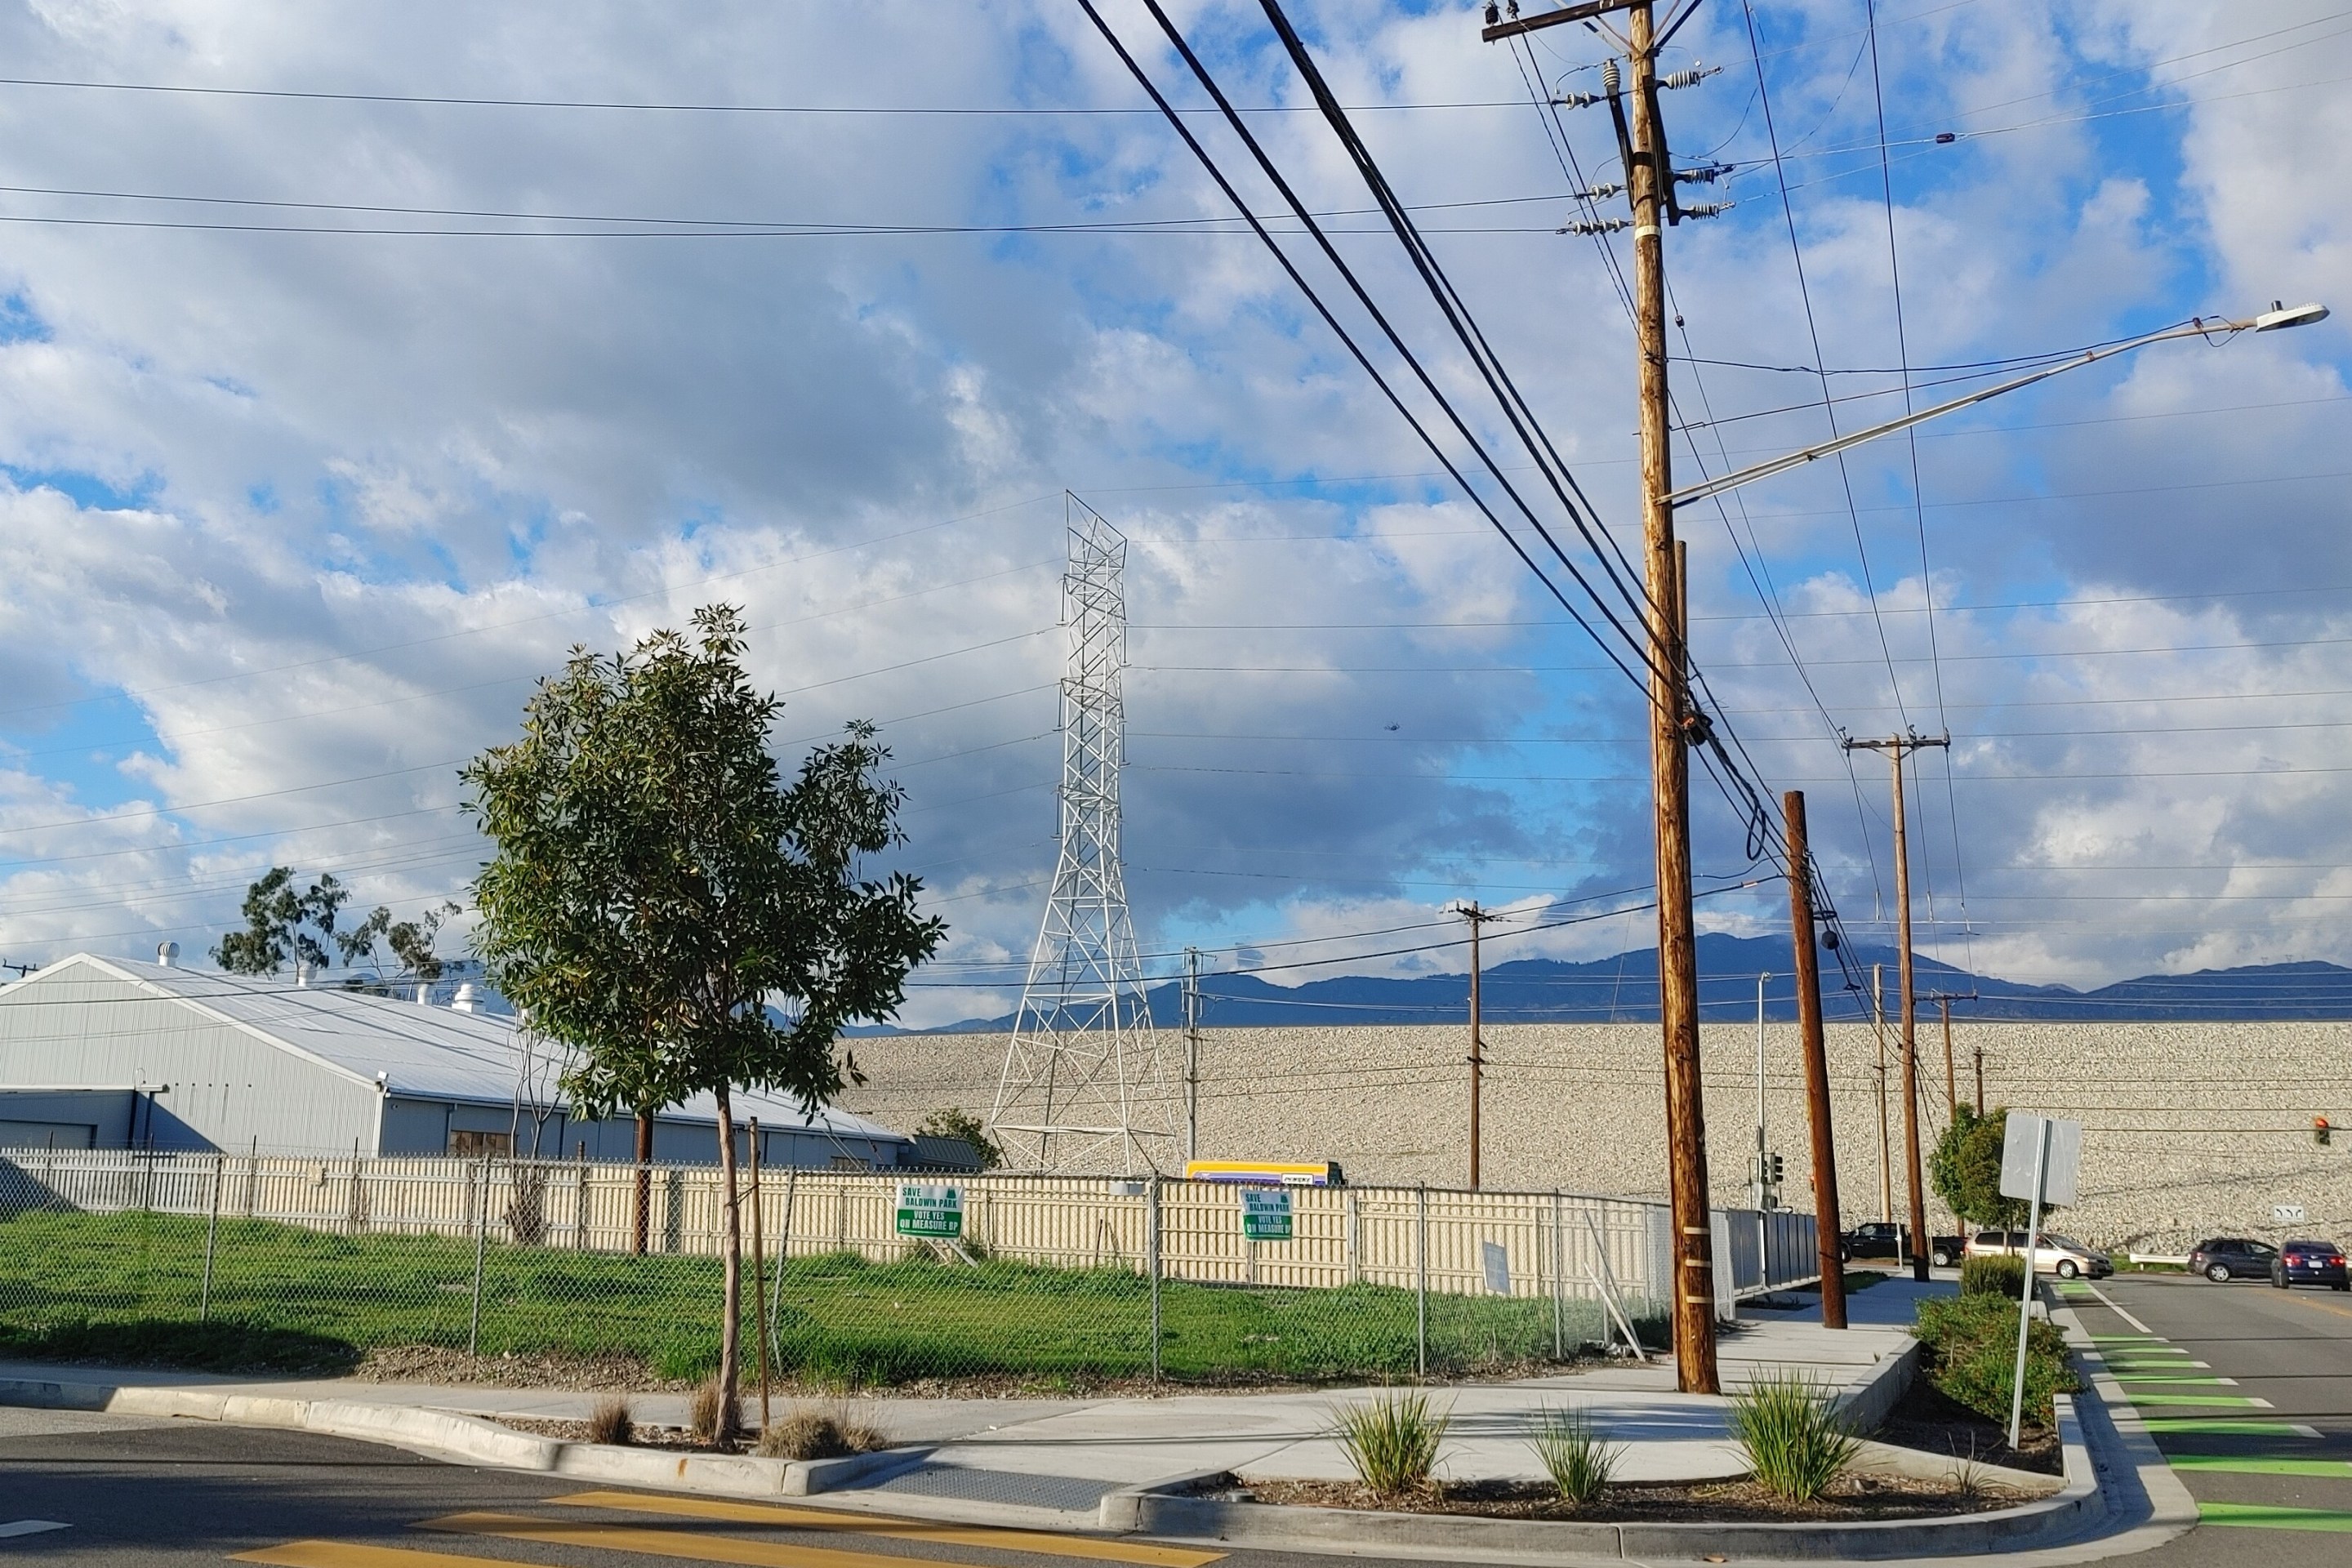
Eyes on the Street: New Lincoln Park Avenue Bike Lanes
The recently installed 1.25-mile long bikeway spans Lincoln Park Avenue, Flora Avenue, and Sierra Street - it's arguably the first new bike facility of the Measure HLA era

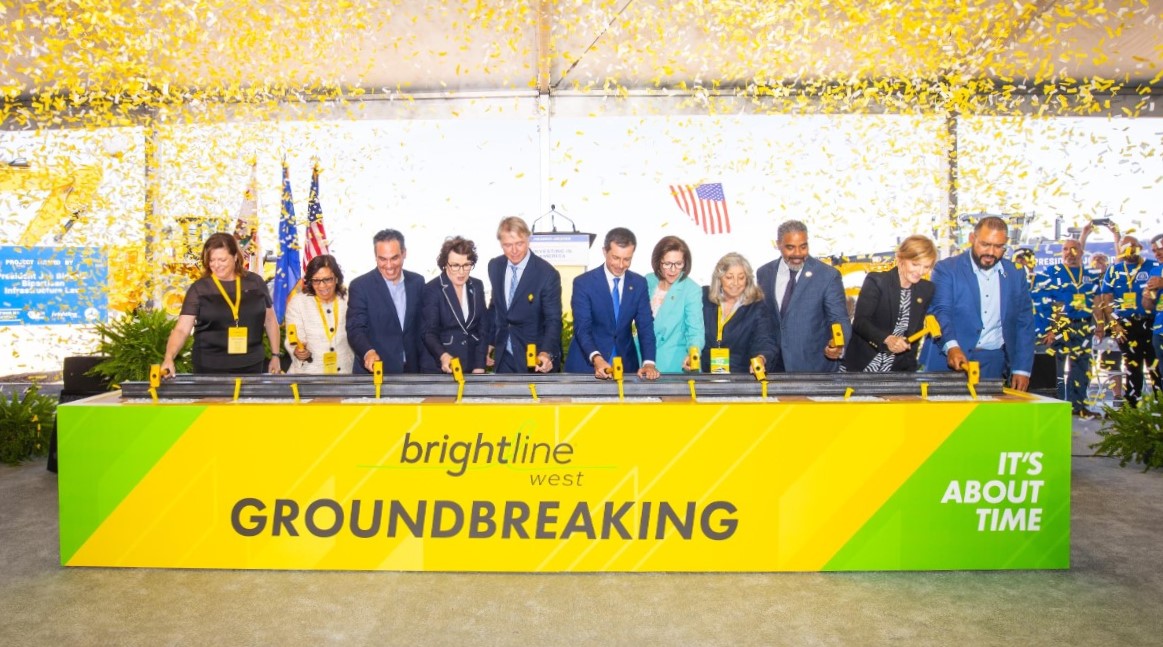
Brightline West Breaks Ground on Vegas to SoCal High-Speed Rail
Brightline West will be a 218-mile 186-mile-per-hour rail line from Vegas to Rancho Cucamonga - about 40 miles east of downtown L.A. - expected to open in 2028
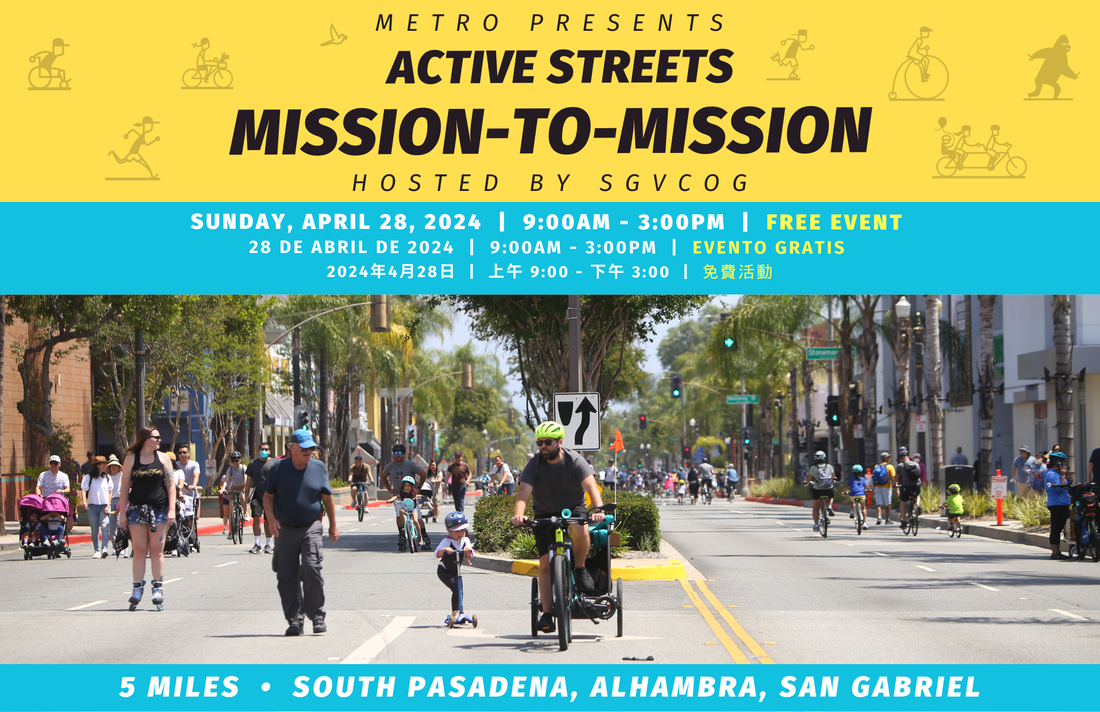
This Week In Livable Streets
Active Streets Mission-to-Mission, LAPD reports on its use of force in 2023, Pasadena Transit plans, Metro subway construction, and more