Some Perspective On How Angelenos Are Driving Less
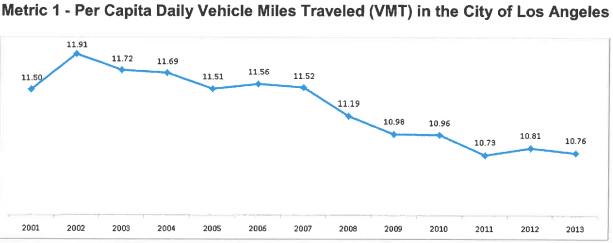
Last week, Los Angeles City Deputy Mayor, and soon-to-be Santa Monica City Manager, Rick Cole tweeted out a graph showing that Angelenos are driving less than we used to. In 2002, the average city resident drove 11.9 miles each day. By 2013, that daily Vehicle Miles Traveled (VMT) has declined to about 10.8 miles each day. I asked Cole for the source of the graph, and his only response, tweeted, was that it's from an "L.A. City Planning Report." Which report is not clear.
The disembodied graph got picked up by L.A. Magazine, Curbed, and LAist. Streetsblog retweeted and put it atop our headlines.
What has caused this shift in 2002? L.A. Magazine suggests that L.A. "has invested heavily in bike and transit infrastructure. Protected bike lanes have opened across the city, along with parking for cycles and sharrows painted on streets." Curbed points to the changes having been "sped up" by the Measure R transportation sales tax.
Hmmmm... This shift started in 2002. Measure R passed in 2008, and its rail, bus, and freeway projects take a few years to build. LADOT implemented its first sharrows in 2010, its first bike parking corral in 2011, and its first and only serious protected bike lane in 2015. LADOT did greatly step up implementation of bike lanes especially from 2010-2012, but I am still waiting for that "invested heavily" stuff. So, all those causes that L.A. Magazine and Curbed are pointing out took place in the later years on the right end of this graph, or or even to the right just off-graph. L.A.'s drop-off in per-person driving started in 2002, well before the transit and bike infrastructure we see today.
I think it's more likely that the last 5 years of somewhat-improved bike and transit facilities are a response to this trend, not a cause of it. I think that city agencies, elected officials, and experts are beginning to catch up with trends that are already happening on our streets.
What's the cause? Anyone who says they know is probably wrong, but I will go ahead and speculate later, at the end of the article. First, a look at how L.A. compares to other places where the declining VMT trend has been observed.
Like Los Angeles, the national trend shows a declining per-capita driving for the past ten years.
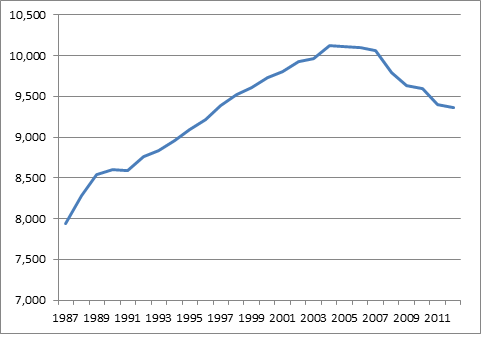
After increasing fairly steeply for decades, the U.S. per-capita driving begins to climb less steeply in the 1990s, then begins to decline around 2002. Different studies put the peak and decline in slightly different places, but the national trend has definitely been downward for about a decade.
The national trend is mirrored by state trends. Some states saw VMT declining in the mid-1990s. California per capita driving has declined since 2002-2003.
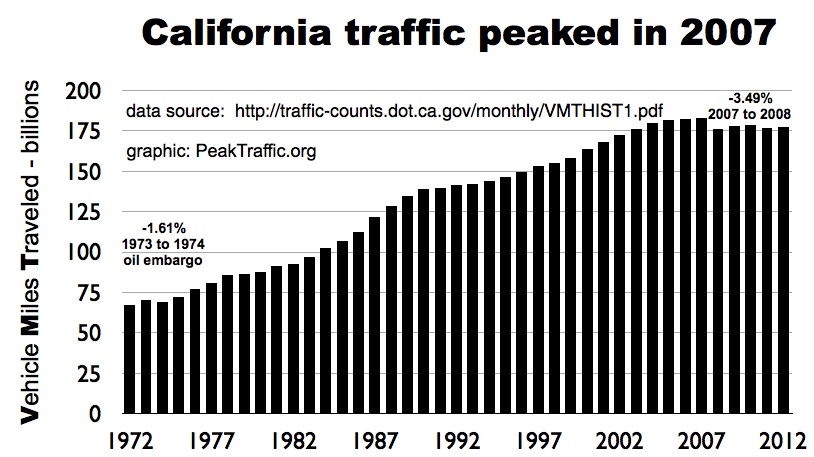
In California, overall driving, not just per-person driving, has been in decline since 2007.
Nobody predicted this trend. Nobody.
Sadly, though we're at least a decade into declining per-person driving, very few transportation agencies and traffic engineers have incorporated these trends in their predictions of future car traffic. Engineers are still predicting that upticks, 1990s-style or 1970s-style, are right around the corner.
Transit expert Jarrett Walker says that these aren't really predictions, but denial.
But it's these kinds of nutty, unprofessional, faulty projections that result in unsafe designs for places like the Glendale-Hyperion Bridge. Car traffic has declined on that bridge for the last 10 years, but sadly L.A. City's engineers are still predicting an uptick in car traffic through 2040.
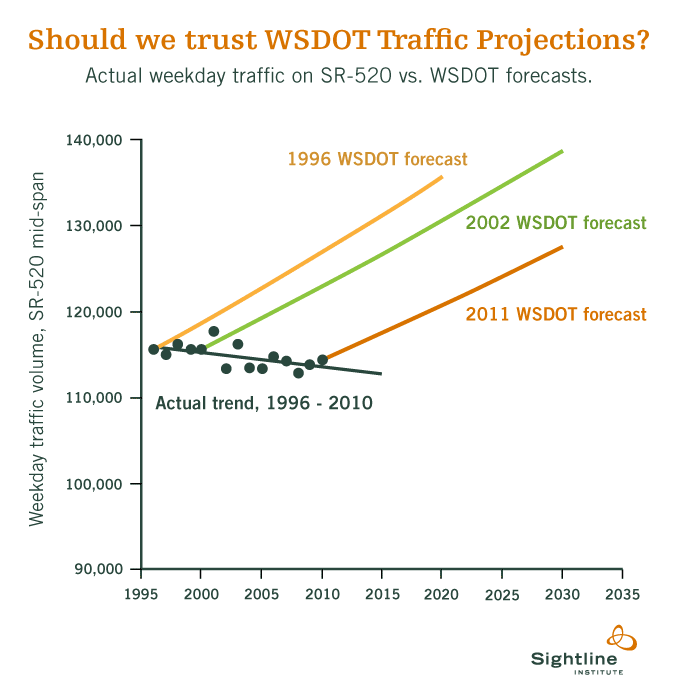
Only in late 2014 did some transportation agencies begun to the be honest and factual in their forecasts; see these graphs from Washington State.
Will this honesty-in-predicting reach California or Los Angeles someday, more than a dozen years into the current trend?
We'll see. Apparently there's a yet-to-be-released Planning Department report on the subject making the rounds with mayoral staff. That's a start. Dear City Planning Department, please cc: the Bureau of Engineering and LADOT.
So, my guess on some factors that may have contributed to L.A.'s VMT has declined recently: (see also Sightline's speculation here)
- demographic shifts: baby boomers are retiring and driving less at the same time as millennials are living in cities and driving less
- modal shifts: many people who used to drive to work now walk, bike, take transit, carpool or work at home
- shorter trips: people aren't moving as far out into sprawling suburbs, so even ones who aren't shifting modes are at least driving shorter trips
- fuel prices: the general upward trend in the price of gasoline discourages driving
- actual limits of car-centric design: not sure how this would ever be proven, but I think that there are probably physical limits of how many cars that can be crammed into a given place, and that continued growth in VMT in these locations results in gridlock that can't be built-out-of at a reasonable cost
My hunch is that these and other factors have played out gradually over time to reduce the amount of driving we do. Readers, what do you think? Why are Angelenos driving fewer miles? What should we do about it?
Stay in touch
Sign up for our free newsletter
More from Streetsblog Los Angeles
This Week In Livable Streets
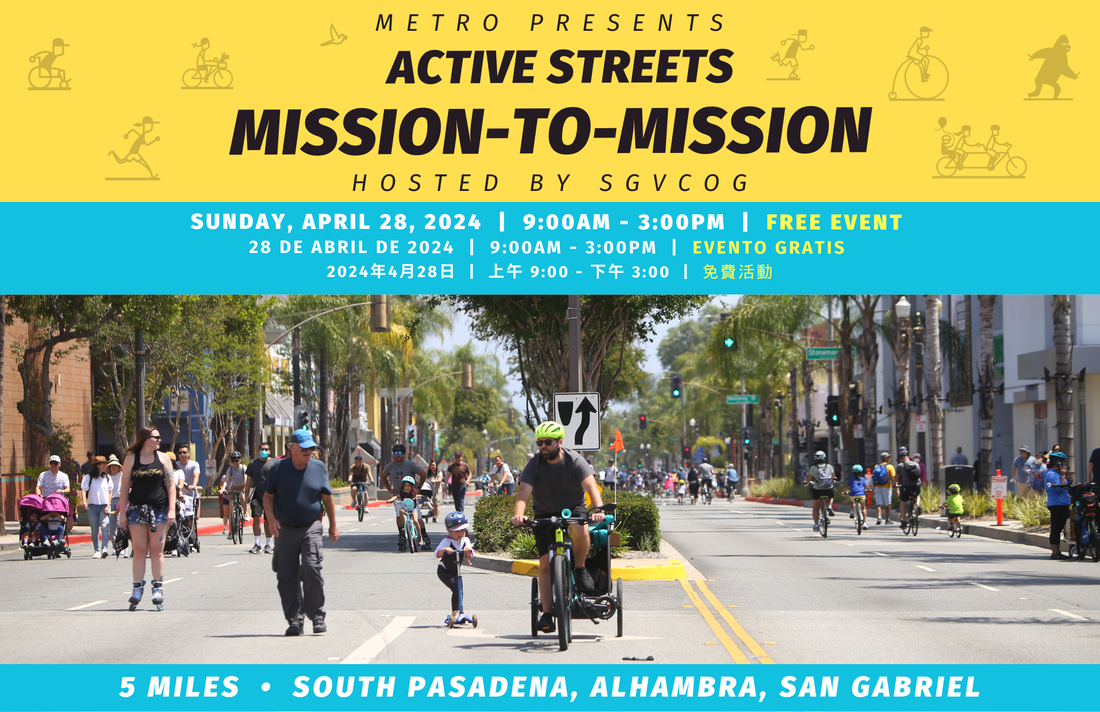
Active Streets Mission-to-Mission, LAPD reports on its use of force in 2023, Pasadena Transit plans, Metro subway construction, and more
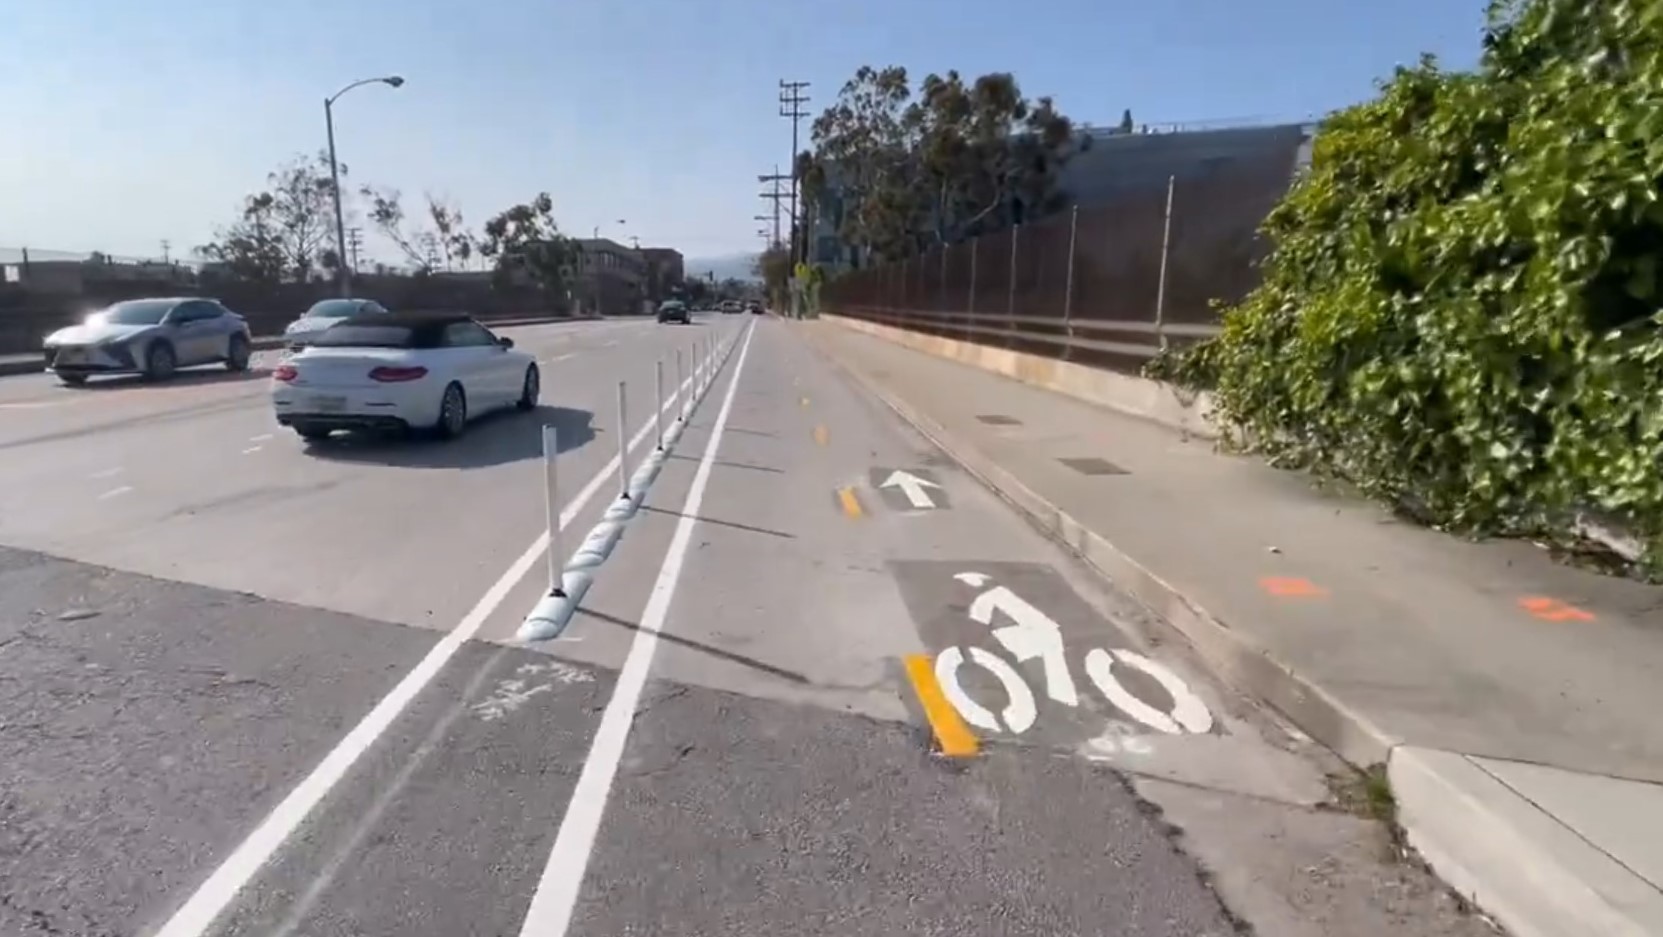
Eyes on the Street: Santa Monica Connection from E Line Bike Path to Downtown Is Almost Complete
“Always be closing gaps in your bikeway network.”

CicLAvia Opens Venice Boulevard – Open Thread
CicLAvia opened six miles of Venice Boulevard - from Culver City Station to Venice Beach
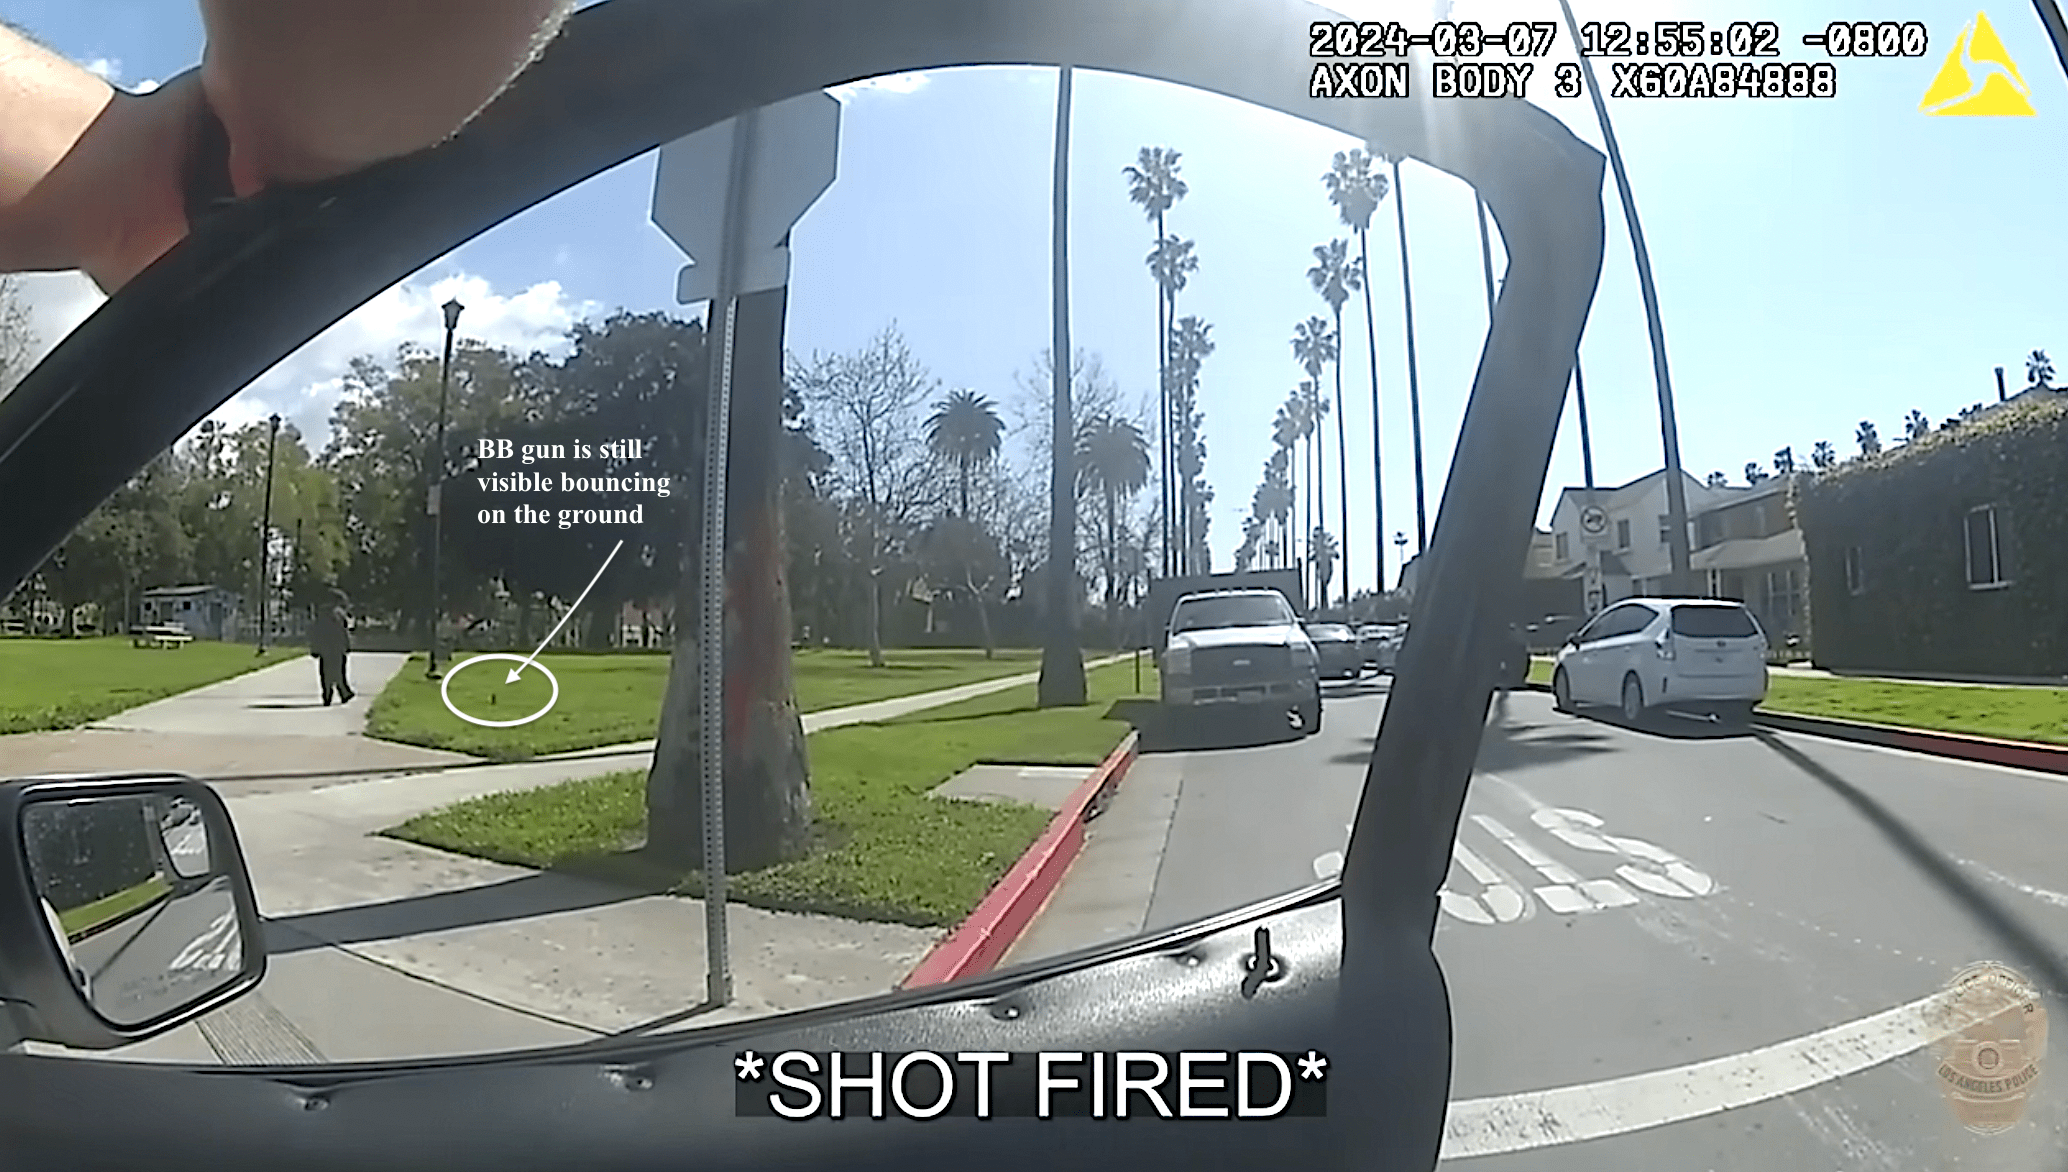
LAPD shoots, strikes unarmed unhoused man as he walks away from them at Chesterfield Square Park
The newly released briefing video depicts Robles as non-compliant and claims officer Gomez-Magallanes shot him for pointing a weapon at officers, but body cam footage shows Gomez-Magallanes continued to fire at - and ultimately hit - Robles after he turned away and tossed the BB gun aside.